No Trade Deal, But A Cease-Fire Propels Markets

Ulli Market Commentary Contact

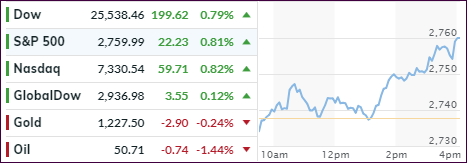
[Chart courtesy of MarketWatch.com]
  1. Moving the markets

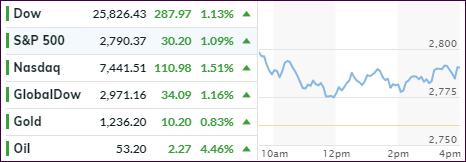
Even poor economic data points such as Ford announcing 25k job cuts, or subprime auto loan issuance soaring, could not derail the no-deal Trump and Xi announcement from the G-20 meeting. The agreement to hold off with any major changes resembled a temporary truce and nothing else. The US agreed to keep the current 10% tariffs for another 3 months in return for China’s promise to purchase a greater amount of American goods.

That was enough for the computer algos to shift into overdrive and push the major indexes higher on a nothing-burger deal that could unravel just as quickly. Said more crudely, it could turn out to be a dump-and-pump scheme.

Be that as it may, for right now the bulls are in charge, and our Domestic Trend Tracking Index (TTI) jumped back above its long-term trend line and into bullish territory by +0.68%. I am always very suspicious of these sudden moves up, or down, and will therefore play it cautiously, since sudden up-moves tend to be of an ephemeral nature and often based on exuberance.

That means, I will watch for a few days to see if these current levels can be sustained or improved upon before issuing a new “Buy” signal for “broadly diversified domestic equity ETFs.” This approach will hopefully contribute to avoid another whip-saw signal. I also plan to allocate only a portion of clients’ asset into the low volatility spectrum.

Stay tuned!
Read More

ETFs On The Cutline – Updated Through 11/30/2018

Ulli ETFs on the Cutline Contact

Below, please find the latest High-Volume ETF Cutline report, which shows how far above or below their respective long-term trend lines (39-week SMA) my currently tracked ETFs are positioned.

This report covers the HV ETF Master List from Thursday’s StatSheet and includes 322 High Volume ETFs, defined as those with an average daily volume of more than $5 million, of which currently 69 (last week 42) are hovering in bullish territory. The yellow line separates those ETFs that are positioned above their trend line (%M/A) from those that have dropped below it.

Take a look:

The HV ETF Master Cutline Report

In case you are not familiar with some of the terminology used in the reports, please read the Glossary of Terms.

If you missed the original post about the Cutline approach, you can read it here.

ETF Tracker Newsletter For November 30, 2018

Ulli ETF Tracker Contact

ETF Tracker StatSheet

https://theetfbully.com/2018/11/weekly-statsheet-for-the-etf-tracker-newsletter-updated-through-11-29-2018/

WHEN FOMO REPLACES FEAR

[Chart courtesy of MarketWatch.com]
  1. Moving the markets

The computer algos had a field day and drove the markets higher based on the assumption that “something could maybe possibly happen” when Trump and Xi meet for dinner this weekend. That sparked a buying panic based on FOMO (Fear Of Missing Out), which put the fear factor that nothing might happen on the back burner. Thanks to the dovish Fed, the major indexes ended the week in the green, thereby recovering all the losses of the Thanksgiving week meltdown and ending the month slightly on a positive note.

The S&P 500 and Nasdaq had their best week in about 7 years but, as I have always said, and as history has shown, some of the biggest market recoveries happen while we’re stuck in bear market territory.

Much of this week’s activity was based on speculation whether the Fed “blinked” by bringing back lower interest rates and bond yields. Right now, it looks that way as the widely followed 10-year bond yield dropped the most in more than a year. It tumbled over 14 basis points in a month to end November at 3.02%.

For sure, that’s what stoked markets over the past week and, if this trend continues, the bulls may very well take the upper hand again. If an assist is thrown via a positive outcome from Trump’s dinner with Xi, and that is still a big uncertainty, we may find ourselves back in domestic equities very soon. Any defusing of trade tensions will get the bullish juices flowing, as we’ve seen in the past, but especially if a verifiable deal is made, we will be off to the races.

We will know more by Monday morning.

Read More

Weekly StatSheet For The ETF Tracker Newsletter – Updated Through 11/29/2018

Ulli ETF StatSheet Contact

ETF Data updated through Thursday, November 29, 2018

Methodology/Use of this StatSheet:

  1. From the universe of over 1,800 ETFs, I have selected only those with a trading volume of over $5 million per day (HV ETFs), so that liquidity and a small bid/ask spread are assured.
  2. Trend Tracking Indexes (TTIs)

Buy or Sell decisions for Domestic and International ETFs (section 1 and 2), are made based on the respective TTI and its position either above or below its long-term M/A (Moving Average). A crossing of the trend line from below accompanied by some staying power above constitutes a “Buy” signal. Conversely, a clear break below the line constitutes a “Sell” signal. Additionally, I use a 7.5% trailing stop loss on all positions in these categories to control downside risk.

  1. All other investment arenas do not have a TTI and should be traded based on the position of the individual ETF relative to its own respective trend line (%M/A). That’s why those signals are referred to as a “Selective Buy.” In other words, if an ETF crosses its own trendline to the upside, a “Buy” signal is generated. Since these areas tend to be more volatile, I recommend a wider trailing sell stop of 7.5% -10% depending on your risk tolerance.

If you are unfamiliar with some of the terminology, please see Glossary of Terms and new subscriber information in section 9.


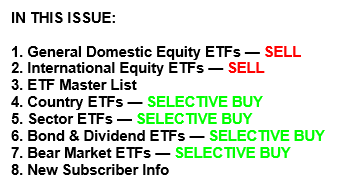
  1. DOMESTIC EQUITY ETFs: SELL — since 11/15/2018

Click on chart to enlarge

Our main directional indicator, the Domestic Trend Tracking Index (TTI-green line in the above chart) is now positioned below its long-term trend line (red) by -0.84% after having generated a new Domestic “Sell” signal effective 11/15/18 as posted.

Read More

Approaching Resistance Levels

Ulli Market Commentary Contact

[Chart courtesy of MarketWatch.com]
  1. Moving the markets

The November Fed minutes revealed that a rate hike was on the horizon, but the path from then on forward was uncertain and that “monetary policy in 2019 was not on a pre-set course.” Additionally, it was made clear that the expectation of 3 hikes was “flexible” and could change, if the economic picture shifted dramatically.

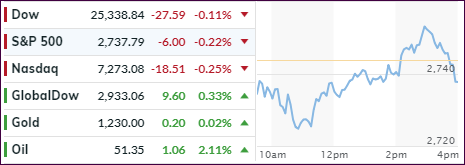
Nothing new there, but the markets took it as less uncertainty than we had prior to yesterday’s announcement, and see-sawed around the unchanged line all day before closing slightly in the red.

Still, the indexes have now recovered to where they are hovering at critical levels with their key moving averages. That simply means that these levels could serve as resistance points or, if broken solidly, as a base for new advances and a break back into bullish territory.

Headline news will likely make that decision, as words like G-20, Fed, Trump and Trade are the ones that will affect market direction soon. Interest rates took a dive with the 10-year bond yield dropping below the 3% level for the first time since the middle of September, before rallying off that point to close at 3.03%. That is an amazing collapse in yields when considering that earlier this month we were at 3.24%.

This makes me wonder if economic conditions are as solid as advertised, because if they were, yields would continue to rise and not drop. Consider, we have a plunge in pending home sales to the weakest in 5 years, jobless claims soaring to 8-month highs, while some car manufacturers are closing plants and laying off workers. These are signs of weakening conditions that may need an assist from the Fed in form of lower rates. Is that why the Fed showed a softer “dovish” side yesterday?

Read More

Fed Head Powell’s Dovish Comments Power The Markets

Ulli Market Commentary Contact

[Chart courtesy of MarketWatch.com]
  1. Moving the markets

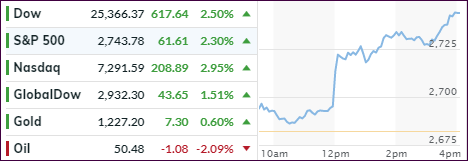
Today, only one topic mattered and that was what Fed chief had to say about interest rates. His comment that they are “just below where they won’t stimulate the economy” was enough to get the buying spree going with the major indexes scoring solidly, as the chart above shows.

The Wall Street crowd interpreted this not only as a softening tone (dovish) regarding future rate hikes but also that we may be close to the “neutral” rate, a level where its alleged effect on economic growth would be neither positive nor negative. These words appear to be a turnaround from comments made in October, when Powell opined that the “central bank may go past neutral, but we’re a long way from neutral at this point, probably.”

That indeed appears to be a change of heart, still, Powell did not mention anything about the expected rate hike at their next meeting in December. Some analysts argued that Powell was not as dovish as was interpreted, as he did not mention any expectations for slower growth or weaker inflation.

In the end, the US Dollar dumped on Powell’s apparent flip flop, but caution is warranted, as one analyst noted:

“The markets are overreacting to what Powell said, perhaps partly because some of the newswire headlines don’t quite accurately convey the nuance of what he said…”

With today’s advance, the S&P has now wiped out its huge Thanksgiving week losses, but it’s too early to tell if this is just one big head fake, especially with China’s trade negotiations on deck in a few days. Again, if these turn out to be positive, our Domestic TTI (section 3) may very well be pushed to the bullish side of its trend line getting us back in the market.

Read More