
- Moving the markets
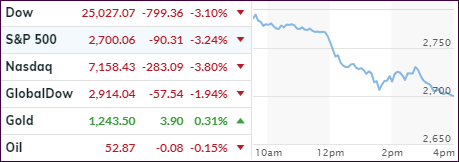
As I pointed our yesterday, sudden up moves can be ephemeral in nature, and even more so when they are based on hope and hot air. This is what we saw today when the nothing-burger, AKA the Trump-Xi non-deal, came back with a vengeance and collapsed the major indexes by over 3%.
Trump confirmed that the trade war is not over, while renaming himself to “Tariff Man.” Really, I am not making this up. In other words, we went from the exuberant truce to brutal realty for the markets in just about one day, which also means the hard-fought gains from the Powell dovishness and the trade cease-fire have just about disappeared.
The major indexes have now crashed back below key technical support levels into bearish territory with Transportations and SmallCaps slipping back into the red YTD.
The second punch of the day came from the interest rate arena, as key yield curves hit the flattest in 11 years with the 3-year and 5-year note inverting for the first time since 2007. What that simply means is that short-term interest rates are higher than long-term ones. The inversion of the 2-year and 10-year, which we are close to, has always been an accurate predictor of recessions.
Yesterday’s small move above the trend line in our Domestic Trend Tracking Index (TTI-section 3), has been reversed, and we are back in alignment with our current model, which shows that we are in bear market territory and therefore have no exposure to equity ETFs (since 11/15/18).
The question in my mind now is whether the markets will head further south and test the October lows, or if magically a year-end rally will materialize. While I have always considered the latter a real possibility, today’s brutal sell-off leaves the future direction wide open.
Right now, it’s good to be on the sidelines…
- ETFs in the Spotlight
In case you missed the announcement and description of this section, you can read it here again.
It features 10 broadly diversified and sector ETFs from my HighVolume list as posted every Saturday. Furthermore, they are screened for the lowest MaxDD% number meaning they have been showing better resistance to temporary sell offs than all others over the past year.
The below table simply demonstrates the magnitude with which some of the ETFs are fluctuating regarding their positions above or below their respective individual trend lines (%M/A). A break below, represented by a negative number, shows weakness, while a break above, represented by a positive percentage, shows strength.
For hundreds of ETF choices, be sure to reference Thursday’s StatSheet.
Year to date, here’s how our original candidates have fared:
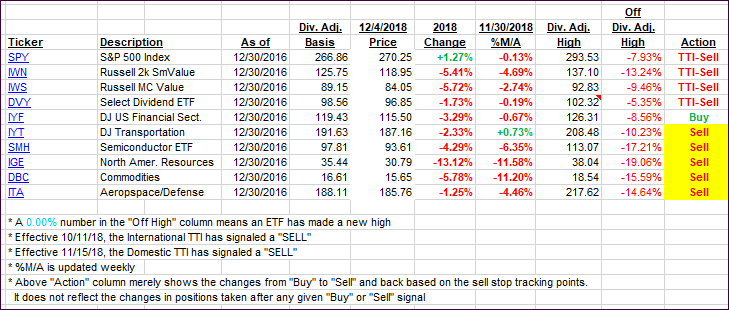
Again, the %M/A column above shows the position of the various ETFs in relation to their respective long-term trend lines, while the trailing sell stops are being tracked in the “Off High” column. The “Action” column will signal a “Sell” once the -8% point has been taken out in the “Off High” column. For more volatile sector ETFs, the trigger point is -10%.
- Trend Tracking Indexes (TTIs)
Our Trend Tracking Indexes (TTIs) followed the theme of the market confirming that the recent bullish move appeared to have been a head fake. We remain in bearish territory.
Here’s how we closed 12/4/2018:
Domestic TTI: -2.34% below its M/A (last close +0.68%)—Sell signal effective 11/15/2018
International TTI: -3.83% below its M/A (last close -1.96%)—Sell signal effective 10/11/2018
Disclosure: I am obliged to inform you that I, as well as my advisory clients, own some of the ETFs listed in the above table. Furthermore, they do not represent a specific investment recommendation for you, they merely show which ETFs from the universe I track are falling.
Contact Ulli