
ETF Tracker StatSheet
MARKETS ON EDGE: MAJOR INDEXES GET CLOBBERED AGAIN
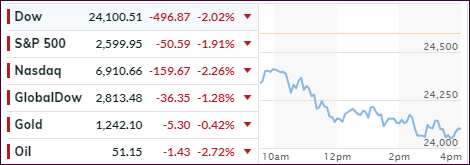
- Moving the markets
As hard as I tried, there was simply no news item to be found anywhere to support the cause for the bulls. US PMI plunged and confirmed a near-record streak of disappointing global data, US Manufacturing disappointed and has stagnated for the 2nd month in a row, while Johnson & Johnson shaved over 100 points off the Dow.
JNJ tanked 10% after reports that the company knew that its baby talcum powder was contaminated with asbestos, a fact that they allegedly had known for decades but failed to disclose to regulators. Ouch!
Poor economic data from China to Europe set the stage early on, as global markets headed south and uncertainty over the unresolved issues of the US/China trade dispute made its presence felt, while growth concerns were coming back into focus.
To no surprise, the major indexes took the path of least resistance and dove with the Dow giving back almost 500 points. The S&P 500 closed at the critical support level of 2,600 and, if broken, will likely make new lows for the year.
ZH summed up the week like this:
- Dow -10.5% from highs
- S&P -11.3% from highs – lowest weekly close since March 2018
- Nasdaq Comp -14.6% from highs
- Trannies -17.8% from highs – Nov 2017 lows, worst 2-week drop since Aug 2011
- Russell 2000 -18.5% from highs – lowest since Sept 2017
Faring even worse were the S&P Banks and Financials, which are both down over 20% off their highs confirming that they are firmly engrained in bear market territory.
For the time being, I believe we are only in the early innings of an impending bear market. While things could turn on a dime, should the bulls find some new ammo, fundamentally global economies have moved into stagnation mode.
Until that changes, and our Trend Tracking Indexes (TTIs) give a new bullish signal, it’s best to be out and stay on the sidelines rather than watch your portfolio potentially get decimated. On that note, since the effective date of our latest Domestic Sell signal (11/15/18), the S&P 500 has dropped -4.60%.
- ETFs in the Spotlight
In case you missed the announcement and description of this section, you can read it here again.
It features 10 broadly diversified and sector ETFs from my HighVolume list as posted every Saturday. Furthermore, they are screened for the lowest MaxDD% number meaning they have been showing better resistance to temporary sell offs than all others over the past year.
The below table simply demonstrates the magnitude with which some of the ETFs are fluctuating regarding their positions above or below their respective individual trend lines (%M/A). A break below, represented by a negative number, shows weakness, while a break above, represented by a positive percentage, shows strength.
For hundreds of ETF choices, be sure to reference Thursday’s StatSheet.
Year to date, here’s how our original candidates have fared:
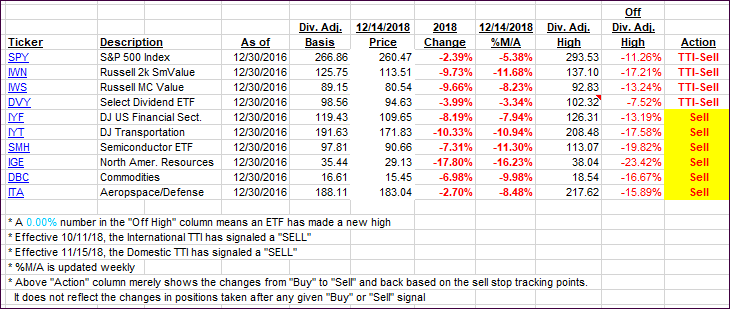
Again, the %M/A column above shows the position of the various ETFs in relation to their respective long-term trend lines, while the trailing sell stops are being tracked in the “Off High” column. The “Action” column will signal a “Sell” once the -8% point has been taken out in the “Off High” column. For more volatile sector ETFs, the trigger point is -10%.
- Trend Tracking Indexes (TTIs)
Our Trend Tracking Indexes (TTIs) took a dive as the markets collapsed again. We remain deeply entrenched in bear territory.
Here’s how we closed 12/14/2018:
Domestic TTI: -6.05% below its M/A (last close -4.84%)—Sell signal effective 11/15/2018
International TTI: -6.68% below its M/A (last close -5.67%)—Sell signal effective 10/11/2018
Disclosure: I am obliged to inform you that I, as well as my advisory clients, own some of the ETFs listed in the above table. Furthermore, they do not represent a specific investment recommendation for you, they merely show which ETFs from the universe I track are falling.
————————————————————-
READER Q & As
All Reader Q & A’s are listed at our web site!
Check it out at:
https://theetfbully.com/questions-answers/
———————————————————-
WOULD YOU LIKE TO HAVE YOUR INVESTMENTS PROFESSIONALLY MANAGED?
Do you have the time to follow our investment plans yourself? If you are a busy professional who would like to have his portfolio managed using our methodology, please contact me directly or get more details at:
https://theetfbully.com/personal-investment-management/
———————————————————
Back issues of the ETF/No Load Fund Tracker are available on the web at:
https://theetfbully.com/newsletter-archives/
Contact Ulli