
- Moving the markets
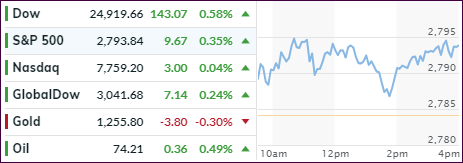
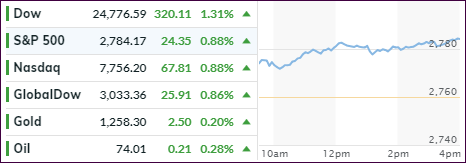
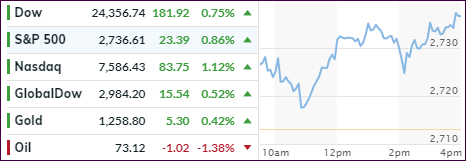
The bullish mood continued with the Dow and the S&P 500 making solid gains, while the Nasdaq lagged and barely stayed above the unchanged line. The Dow had its best win streak in the past 30 days, while the S&P 500 was homing in on a new 5-month high.
However, when looking at the bigger picture, the markets were mixed, if you take out the Dow and S&P 500. SmallCaps, despite being a top YTD performer, lagged and so did Transportations while, as mentioned above, the Nasdaq ended barely changed after making a record intra-day high.
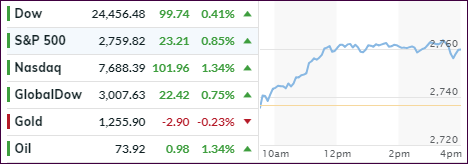
This is now the fourth straight finish solidly in the green, as concerns over global trade disputes have clearly shifted with most of the focus now being on the upcoming second quarter earnings season, while newfound optimism over recent positive economic data points gave a much needed assist. One can only hope that recent trade tensions remain in the background.
I think we’ll find out quick if they will remain subdued, or if they suddenly make their make their presence felt by pulling some of the exuberance out of the markets.