
- Moving the markets
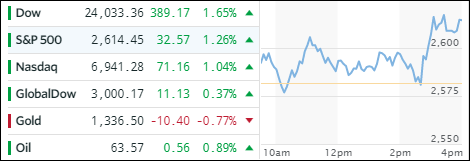
We started the session on a positive note, after yesterday’s drubbing, with the major indexes hovering above and slightly below their respective unchanged lines, as the beaten down tech sector showed signs of life. That caused me to hold off with my planned liquidation of one of our holdings, as we moved away from the trailing sell stop.
I also was watching the international ETFs very closely as my International TTI had slipped below its long term trend line, but only by a small margin (as I posted yesterday), which I considered inconclusive as far as the magnitude of the trend line break was concerned. That sector rallied as well, so no action was required on my part.
Early afternoon, as the S&P retreated off its highs and touched its unchanged line, out of nowhere, buyers appeared resulting in a buying panic to drive the indexes to session highs. What happened? Zerohedge describes it best:
It was generally a quiet day, with no macro news and equities range-bound, seemingly spooked by the ongoing verbal war between Trump and Jeff Bezos, where first in a tweet then a White House press conference, the president warned that US taxpayers will no longer subsidize Amazon “by the billions.” And, as has been the case recently, every time Trump spoke or tweeted, Amazon turned negative.
And then, just around 2:45pm, a Bloomberg headline hit, according to which President Trump is not formally looking at options to address his concerns with Amazon, which immediately unleashed a buying panic first in Amazon and then across the broader market.
In my mind, the questions is whether Trump’s feud with Amazon will eventually run its course and subside, so Wall Street has one less thing to worry about and can push equities back towards all-time highs. Or, will Trump be the tough guy and risk a market meltdown? I guess we will find out soon.
- ETFs in the Spotlight
In case you missed the announcement and description of this section, you can read it here again.
It features 10 broadly diversified and sector ETFs from my HighVolume list as posted every Saturday. Furthermore, they are screened for the lowest MaxDD% number meaning they have been showing better resistance to temporary sell offs than all others over the past year.
The below table simply demonstrates the magnitude with which some of the ETFs are fluctuating in regards to their positions above or below their respective individual trend lines (%M/A). A break below, represented by a negative number, shows weakness, while a break above, represented by a positive percentage, shows strength.
For hundreds of ETF choices, be sure to reference Thursday’s StatSheet.
Year to date, here’s how our candidates have fared so far:
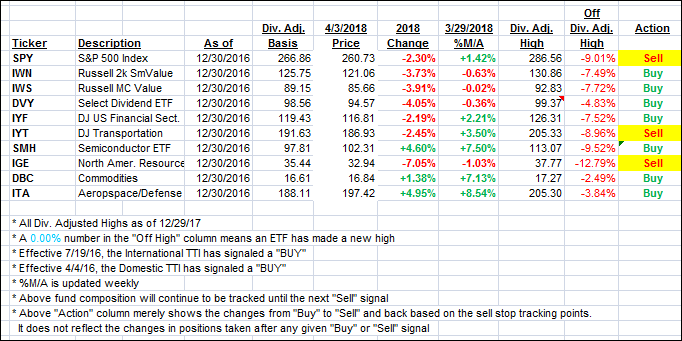
Again, the %M/A column above shows the position of the various ETFs in relation to their respective long term trend lines, while the trailing sell stops are being tracked in the “Off High” column. The “Action” column will signal a “Sell” once the -7.5% point has been taken out in the “Off High” column.
- Trend Tracking Indexes (TTIs)
Our Trend Tracking Indexes (TTIs) recovered but still remain in striking distance of moving into bearish territory.
Here’s how we closed 4/3/2018:
Domestic TTI: +0.82% above its M/A (last close +0.36%)—Buy signal effective 4/4/2016
International TTI: +0.48% below its M/A (last close -0.23%)—Buy signal effective 7/19/2016
Disclosure: I am obliged to inform you that I, as well as my advisory clients, own some of the ETFs listed in the above table. Furthermore, they do not represent a specific investment recommendation for you, they merely show which ETFs from the universe I track are falling within the guidelines specified.
Contact Ulli