
- Moving the markets
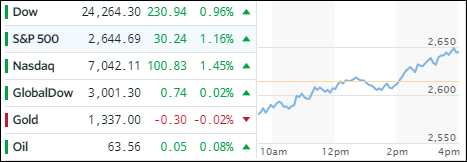
The chart above showing today’s rebound simply does not do justice to what actually happened. Right after the opening bell, the Dow plunged some 600 points only to begin a slow comeback and, along with the other major indexes, managed not only to recoup all early losses but turn the session into solid gains. In the end, the Dow traded in a range of some 840 points.
Causing this early turmoil was China’s announcement that it would slap tariffs on $50 billion of 106 billion of US imports. This was not really earthshaking news, as such possibility had been telegraphed a couple of weeks ago, but Wall Street’s short term memory would have none of that and down we went.
Igniting the rebound was the new kid on the block, namely Trump’s new National Economic Council director Larry Kudlow who said that “stock markets shouldn’t overreact to trade tensions between US and China because proposals by both countries are a first step and haven’t been implemented,” and offered even more soothing words by opining that “it is possible the tariffs will never come to pass.”
That was all it took, and the early dump turned into a successful pump. Needless to say, all red numbers vanished, and we closed solidly in the green with the S&P 500 regaining its 200-day M/A and the VIX dropping below 20. The 10-year bond yield remained unchanged, while the US Dollar went nowhere fast and gave back -0.04%.
While it’s been a wild ride this week, nothing has been gained or lost, because we’re just about back to the point (S&P) where we started. Let’s see if the next headlines have some more volatility surprises for us in store.
- ETFs in the Spotlight
In case you missed the announcement and description of this section, you can read it here again.
It features 10 broadly diversified and sector ETFs from my HighVolume list as posted every Saturday. Furthermore, they are screened for the lowest MaxDD% number meaning they have been showing better resistance to temporary sell offs than all others over the past year.
The below table simply demonstrates the magnitude with which some of the ETFs are fluctuating in regards to their positions above or below their respective individual trend lines (%M/A). A break below, represented by a negative number, shows weakness, while a break above, represented by a positive percentage, shows strength.
For hundreds of ETF choices, be sure to reference Thursday’s StatSheet.
Year to date, here’s how our candidates have fared so far:
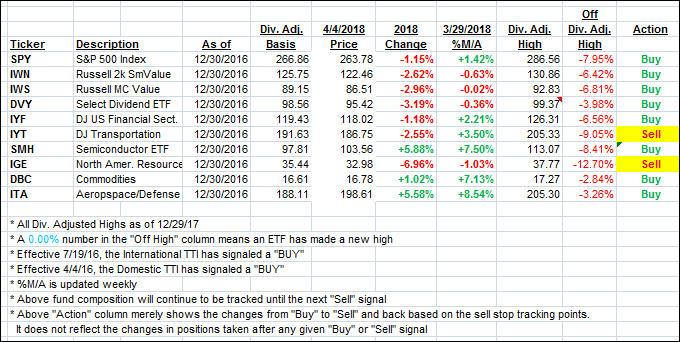
Again, the %M/A column above shows the position of the various ETFs in relation to their respective long term trend lines, while the trailing sell stops are being tracked in the “Off High” column. The “Action” column will signal a “Sell” once the -7.5% point has been taken out in the “Off High” column.
- Trend Tracking Indexes (TTIs)
Our Trend Tracking Indexes (TTIs) inched higher as the markets staged a massive recovery.
Here’s how we closed 4/4/2018:
Domestic TTI: +0.82% above its M/A (last close +1.26%)—Buy signal effective 4/4/2016
International TTI: +0.88% below its M/A (last close +0.48%)—Buy signal effective 7/19/2016
Disclosure: I am obliged to inform you that I, as well as my advisory clients, own some of the ETFs listed in the above table. Furthermore, they do not represent a specific investment recommendation for you, they merely show which ETFs from the universe I track are falling within the guidelines specified.
Contact Ulli