ETF Tracker StatSheet
https://theetfbully.com/2019/03/weekly-statsheet-for-the-etf-tracker-newsletter-updated-through-02-28-2019/
Pumping, Dumping and Pumping
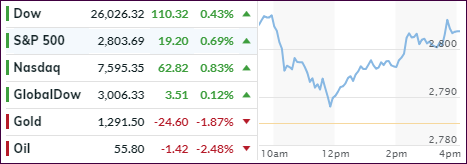
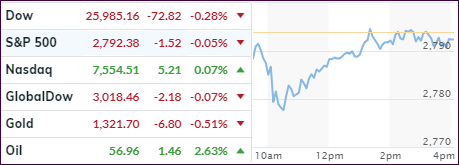
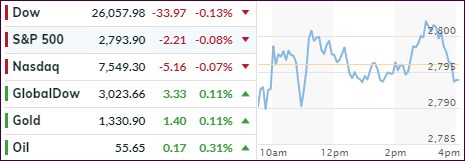
[Chart courtesy of MarketWatch.com]
- Moving the markets
An early rally petered out mid-day, but renewed investor optimism pulled the major indexes out of a hole and pushed them higher with the S&P 500 finally reclaiming and closing above the 2,800-resistance level for the first time in 4 months.
The Dow managed to close above the psychologically important 26k marker with both indexes snapping a three-day losing streak, while the Nasdaq notched its longest win streak since 1999 (10 weeks). All in the face of deteriorating econ data and rising interest rates.
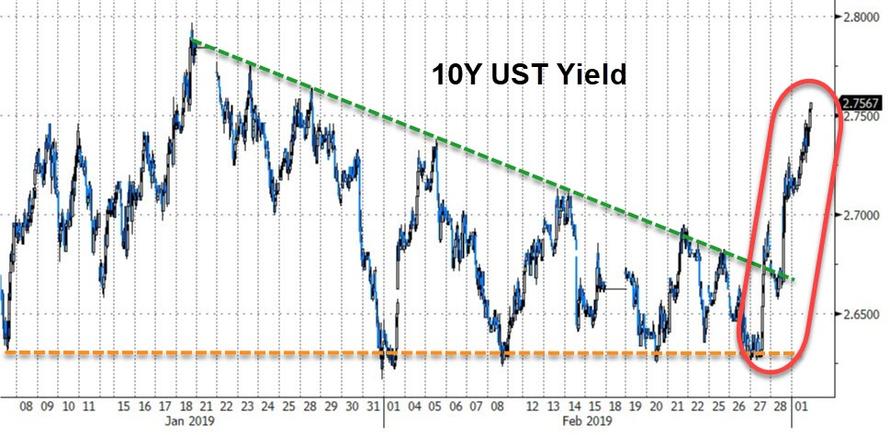
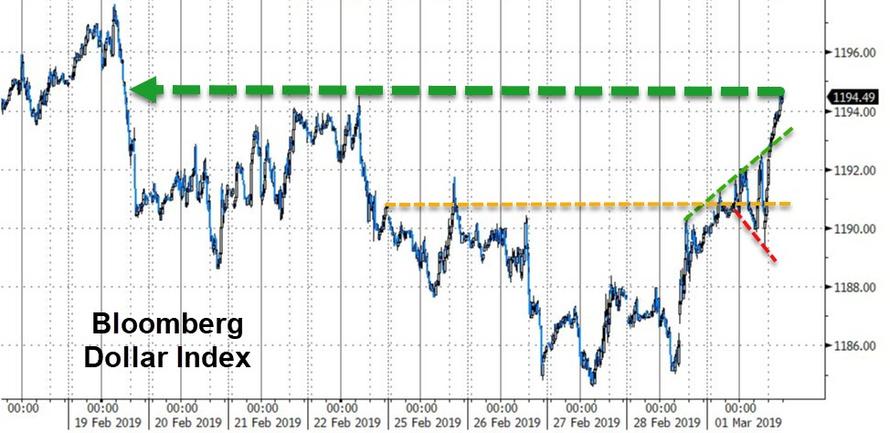
The 10-year bond yield has broken out of a triangle formation and spiked upwards extending its rise from the past week causing the widely held 20-year bond TLT to drop -1.13%, which helped the U.S. Dollar rally and score a solid week.
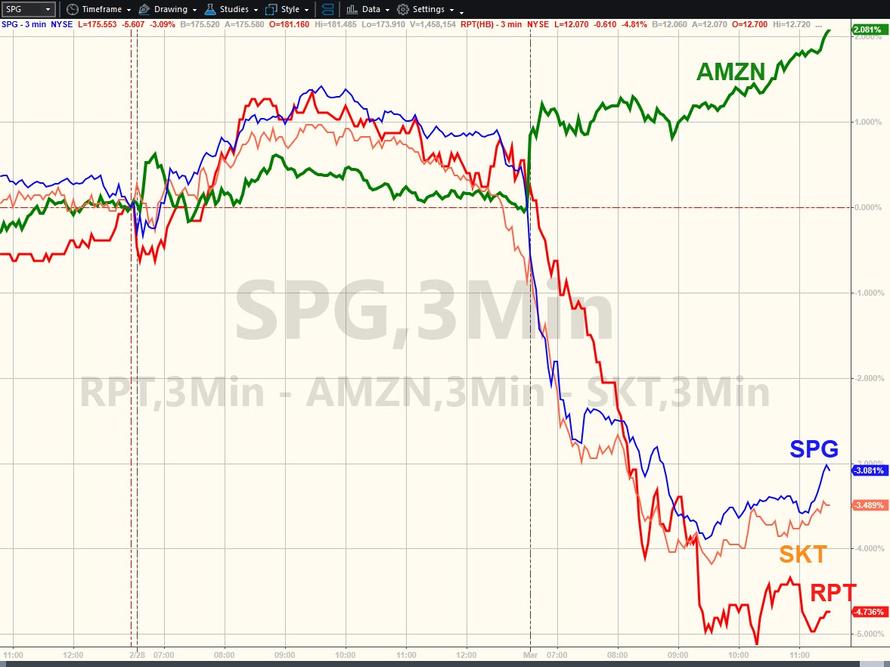
Sure, hope for a conclusion of a U.S.-China trade deal reigned supreme but nothing concrete was announced, so we rallied primarily on hope, because other data points were less than awe inspiring. Mall operators announced some 300 store closings, which pushed some of their stock prices considerably lower.
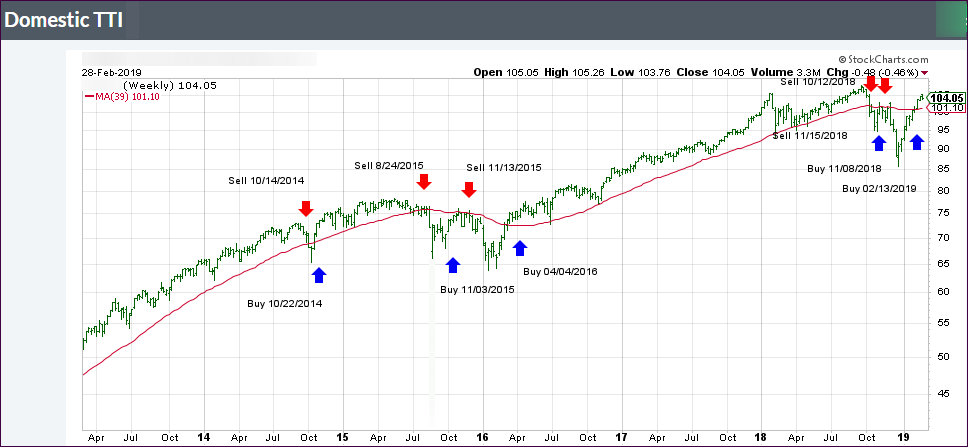
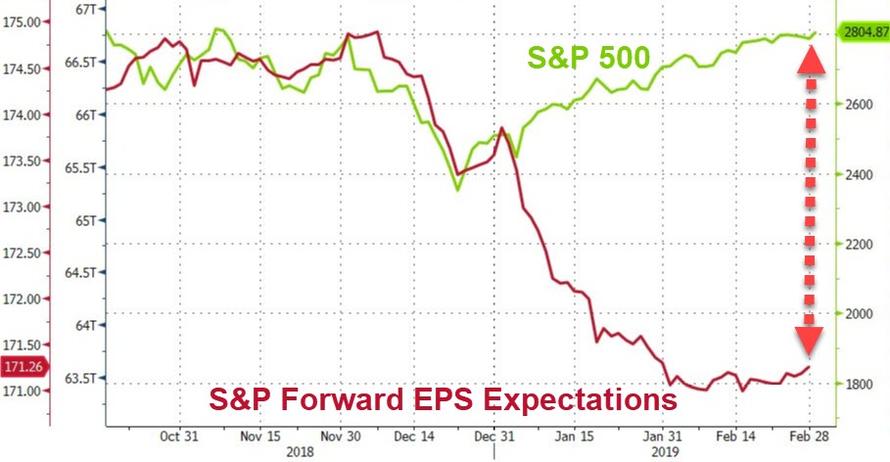
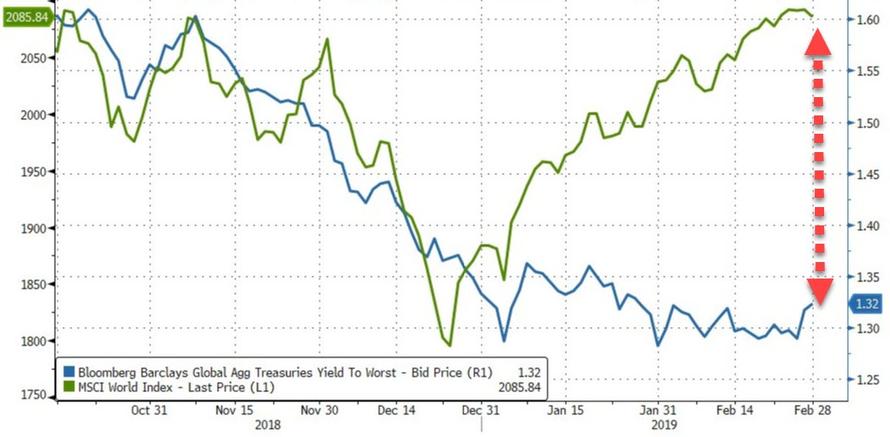
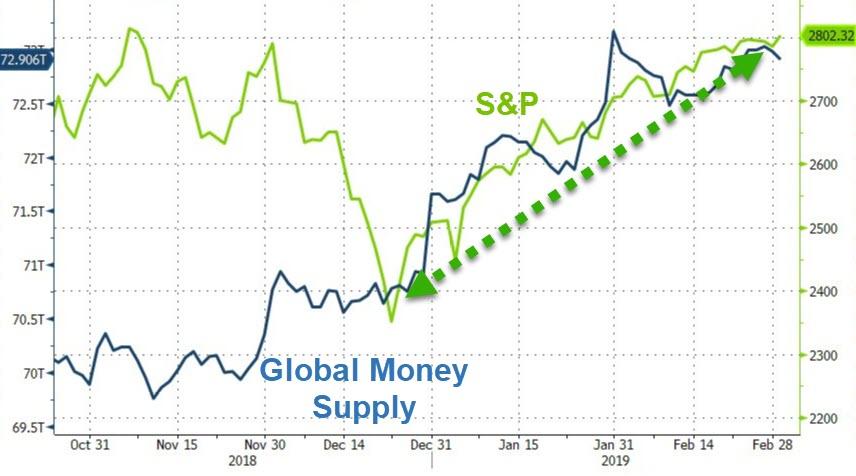
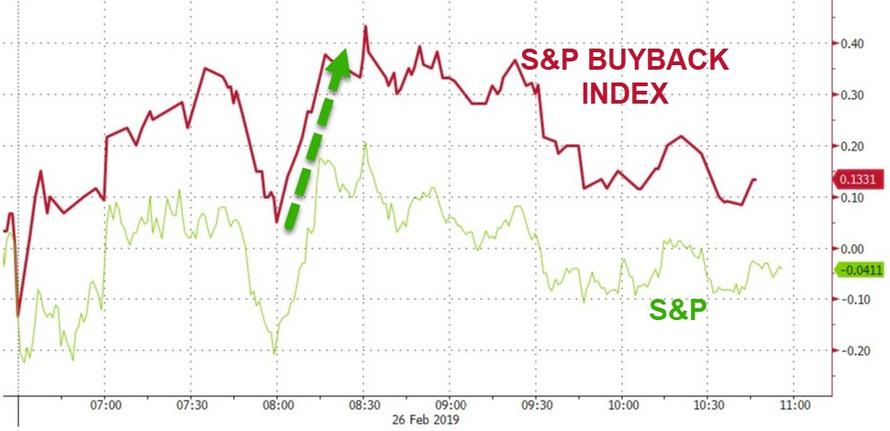
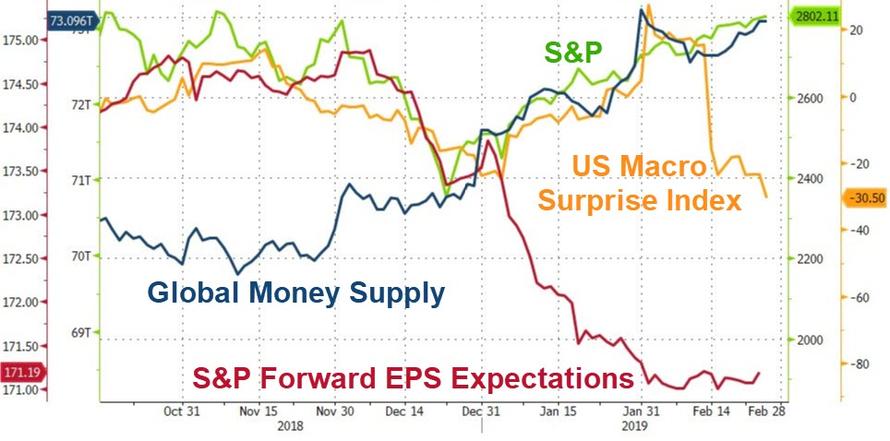
As trend followers, however, we are only concerned with the long-term direction of the trend rather than what drives it. Nevertheless, it’s wise to look under the hood sometimes to see what might be behind it. These days, its hard to find sound reasons, as ZH pondered with these 4 charts: one, two, three, four.
Now you know what is, and is not, behind the relentless drive to higher prices with chart 4 being the master of the equity universe.
Read More