Gold And Bitcoin Steal The Show As Tech Stocks Crash And Nvidia Spooks

Ulli Market Commentary Contact

[Chart courtesy of MarketWatch.com]

  1. Moving the markets

The U.S. stock market took another hit on Tuesday, as big tech stocks like Apple dragged it down further from its recent record highs. Apple lost almost 3% after a report showed that its iPhone sales tanked in China in the first six weeks of 2024.

Other tech giants such as Tesla, Netflix and Microsoft also fell more than 2%, pulling the S&P 500’s information technology sector down by more than 2%. The sector was the worst performer of the day.

The market’s slide came as traders took a breather from the rally that was fueled by excitement around artificial intelligence. Despite the losses, the three main stock indexes are still up for the year.

Bitcoin was the star of the show, hitting a new record high in the morning. But the party was short-lived, as the cryptocurrency quickly turned red after reaching the peak for the first time in two years.

It was a roller-coaster day for traders, with highs (gold bulls cheered as the precious metal hit a new high), lows (bitcoin bulls cried as the digital coin reversed its gains), and crashes (Nasdaq and MAG7 stocks had their worst day since October).

Bond yields dipped, the MAG7 stocks bounced off their trend line, Apple plunged to its October levels, but gold glittered by reaching a new high, while oil prices slid lower.

ZeroHedge summed it up: Be careful, if you compare Nvidia’s chart from 2020 to now with Cisco’s chart from 1996 to 2002, and zoom in in 2000, you’ll see a spooky similarity.

Coincidence or curse?

Read More

How NVDA Is Chasing Cisco’s Record As Gold And Bitcoin Soar

Ulli Market Commentary Contact

[Chart courtesy of MarketWatch.com]

  1. Moving the markets

The Dow Jones Industrial Average took a break on Monday after hitting new highs in a rally driven by artificial intelligence stocks. Apple dropped more than 2% after the European Union slapped it with a $2 billion fine for abusing its market power in music streaming.

The Nasdaq Composite, which is loaded with tech stocks, reached a record high on Friday, breaking its previous peak from 2021. It was the last of the major stock indexes to do so this year.

This week, traders will be watching Federal Reserve Chair Jerome Powell for hints on where interest rates are headed. He will give updates on monetary policy to the House on Wednesday and to the Senate on Thursday.

On Wednesday, we will also get some data on the job market, with the ADP Employment Survey and the January job openings report. On Friday, we will see how many jobs were added or lost in February.

Today, gold and bitcoin shone brightly, reaching new closing highs, as investors expected lower interest rates and more money printing from the Fed. Gold defied the low inflation narrative and bitcoin broke $67,000, eyeing its old record.

Meanwhile, stocks were mostly flat, with small caps rising and falling in sync with the European market. A late sell-off pushed the Nasdaq to the bottom of the pack, making it the worst performer of the day.

Bond yields went up, the dollar went down, but both stayed within their recent ranges. NVDA, however, kept going up, adding another 6% to its price.

With this surge, NVDA is almost catching up with Cisco’s historical highs.

Will NVDA make history or repeat it?

Read More

ETFs On The Cutline – Updated Through 03/01/2024

Ulli ETFs on the Cutline Contact

Do you want to know which ETFs are hot and which ones are not? Then you need my High-Volume ETF Cutline report. It tells you how close or far each of the 311 ETFs I follow is from its long-term trend line (39-week SMA). These are the ETFs that trade more than $5 million a day, so they are not some obscure funds that nobody cares about.

The report is split into two parts: The winners that are above their trend line (%M/A), and the losers that are below it. The yellow line is the line of shame that separates them. You can see how many ETFs are in each group and how they have changed since the last report (261 vs. 265 current).

Take a peek:

The HV ETF Master Cutline Report

If you are confused by some of the terms we use, don’t panic. I have a helpful Glossary of Terms for you.

If you want to learn more about the Cutline method and how it can make you rich (or at least less poor), read my original post here.

ETF Tracker Newsletter For March 1, 2024

Ulli ETF Tracker Contact

ETF Tracker StatSheet          

You can view the latest version here.

THE NASDAQ HITS A NEW HIGH: IS THIS A BUBBLE OR A BOOM?

[Chart courtesy of MarketWatch.com]

  1. Moving the markets

The Nasdaq Composite hit a new record high on Friday, breaking its previous peak from 2021.

Investors were betting big on mega cap tech stocks, hoping to cash in on the slowing inflation and the upcoming artificial intelligence boom. Artificial intelligence was the buzzword of the year, boosting the value of mega cap tech stocks – and the whole market – throughout 2023 and into 2024. The Nasdaq bounced back from a rough 2022, thanks to the Fed’s anticipated rate cuts and the alleged slowdown of inflation.

Not everyone was celebrating, though. New York Community Bancorp, a regional bank with some serious issues, plunged 24% after announcing a change in leadership and some internal problems. The bank had already lost more than 63% of its value in 2024, raising fears of a looming real estate crisis.

But the bulls were not deterred by the bad news. Even dismal data like the shrinking manufacturing sector, the falling construction spending, the declining consumer confidence, and the rising inflation expectations could not dampen their spirits.

As ZeroHedge pointed out, bad news is good news, especially when the Fed’s Waller hinted at a new QE ‘Reverse Twist’ for the balance sheet. This means the Fed will buy more short-term Treasuries and sell more Agency MBS, effectively printing more money. And more money means more fun, right?

The market rallied across the board: Stocks soared, gold glittered, Treasury yields tumbled (and the yield curve steepened… in a good way), oil surged (and so did crypto, despite its roller-coaster ride).

NVDA was the star of the show, closing above $2TN market cap for the first time. To put that in perspective, the company was worth $280BN in Oct 2022. That’s a lot of zeros.

Bond yields also dropped, helping equities along the way, while the dollar weakened, and gold reached its highest level since December. Oil prices also spiked and closed at their highest level since November 6th.

With such a bullish mood, it seems like there is still room for growth, if this chart is anything to go by.

Or is this the calm before the storm?

Read More

Weekly StatSheet For The ETF Tracker Newsletter – Updated Through 02/29/2024

Ulli ETF StatSheet Contact

ETF Data updated through Thursday, February 29, 2024

How to use this StatSheet:

  1. Out of the 1,800+ ETFs out there, I only pick the ones that trade over $5 million per day (HV ETFs), so you don’t get stuck with a lemon that nobody wants to buy or sell.
  1. Trend Tracking Indexes (TTIs)

These are the main indicators that tell you when to buy or sell Domestic and International ETFs (section 1 and 2). They do that by comparing their position to their long-term M/A (Moving Average). If they cross above, and stay there, it’s a green light to buy. If they fall below, and keep going, it’s a red light to sell. And to make sure you don’t lose your shirt if things go south, I also use a 12% trailing stop loss on all positions in these categories.

  1. All other investment areas don’t have a TTI and should be traded based on the position of each ETF relative to its own trend line (%M/A). That’s why I call them “Selective Buy.” In other words, if an ETF goes above its own trend line, you can buy it. But don’t forget to use a trailing sell stop of 12%, or less if you’re feeling nervous.

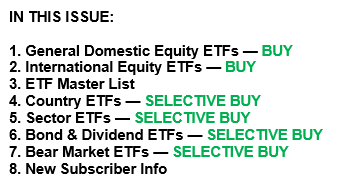
If some of these words sound like Greek to you, please check out the Glossary of Terms and new subscriber information in section 9.

  1. DOMESTIC EQUITY ETFs: BUY— since 11/21/2023

Click on chart to enlarge

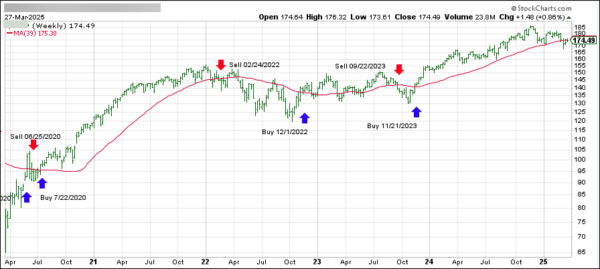
This is our main compass, the Domestic Trend Tracking Index (TTI-green line in the above chart). It has broken above its long-term trend line (red) by +9.41% and is in “Buy” mode as posted.

Read More

Inflation Report No Surprise, S&P 500 Rises On Last Day Of February

Ulli Market Commentary Contact

[Chart courtesy of MarketWatch.com]

  1. Moving the markets

The S&P 500 edged up on the last day of February, as investors shrugged off an inflation report that met expectations and looked at some upbeat consumer spending data.

The Fed’s favorite inflation indicator, the core PCE index, rose by 0.4% in January and 2.8% year-over-year, matching the Dow Jones estimates. The headline PCE index, which includes food and energy, also matched the forecasts, rising by 0.3% monthly and 2.4% annually.

This was good news for the bulls, who feared that inflation would spike and force the Fed to delay or reverse its rate cuts. They came back to the market and lifted the indexes.

On the other hand, pending home sales disappointed in January, falling by 4.9% instead of rising by 2% as expected. Mortgage rates fluctuated and dampened the demand for houses.

February ended with a green month for the three major averages, despite some recent dips that cast doubt on the durability of the AI-led rally.

ZeroHedge summed up February like this:

Cryptos rocked, stocks rolled, bonds flopped, and rate-cut hopes dropped.

The odds of a rate cut in March went from 60% to zero, and the odds of a rate cut in May went from 100% to 18%. July is now the most likely month for a rate cut.

The MAG7 stocks gained more than 7% in February, but they stalled after the initial surge. As the rate-cut hopes faded and the economic data improved, bond yields climbed, the dollar strengthened for the second month in a row, while gold ended February flat. Oil prices rose with WTI nearing $79.

The real action was in crypto, where Ethereum beat Bitcoin (+49% vs. +45%) and the latter almost reached $64,000. The Nasdaq still follows the pattern of 1999-2001, but it raises this question:

Will March be a lion or a lamb?

Read More