
ETF Tracker StatSheet
You can view the latest version here.
THE NASDAQ HITS A NEW HIGH: IS THIS A BUBBLE OR A BOOM?
- Moving the markets
The Nasdaq Composite hit a new record high on Friday, breaking its previous peak from 2021.
Investors were betting big on mega cap tech stocks, hoping to cash in on the slowing inflation and the upcoming artificial intelligence boom. Artificial intelligence was the buzzword of the year, boosting the value of mega cap tech stocks – and the whole market – throughout 2023 and into 2024. The Nasdaq bounced back from a rough 2022, thanks to the Fed’s anticipated rate cuts and the alleged slowdown of inflation.
Not everyone was celebrating, though. New York Community Bancorp, a regional bank with some serious issues, plunged 24% after announcing a change in leadership and some internal problems. The bank had already lost more than 63% of its value in 2024, raising fears of a looming real estate crisis.
But the bulls were not deterred by the bad news. Even dismal data like the shrinking manufacturing sector, the falling construction spending, the declining consumer confidence, and the rising inflation expectations could not dampen their spirits.
As ZeroHedge pointed out, bad news is good news, especially when the Fed’s Waller hinted at a new QE ‘Reverse Twist’ for the balance sheet. This means the Fed will buy more short-term Treasuries and sell more Agency MBS, effectively printing more money. And more money means more fun, right?
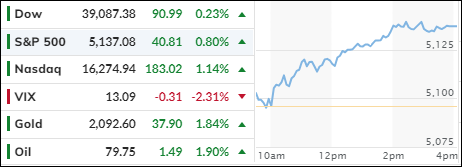
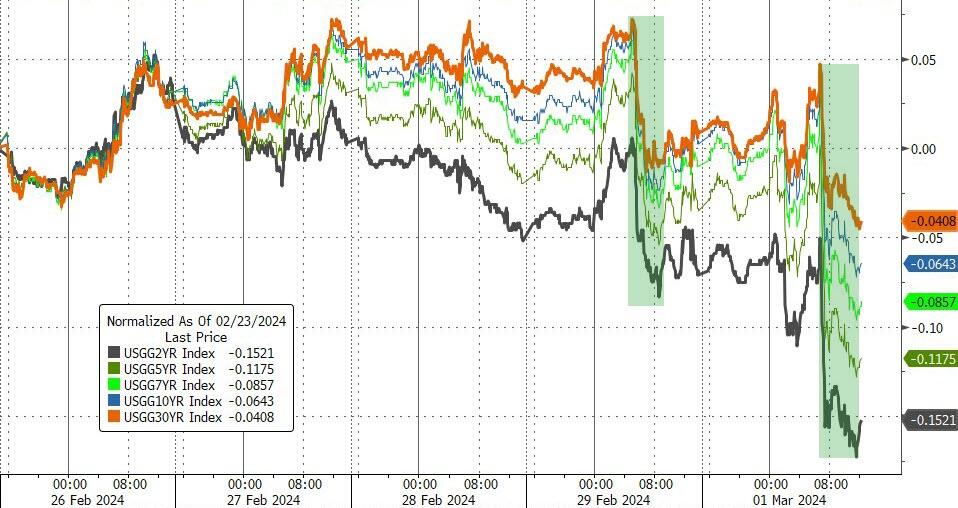
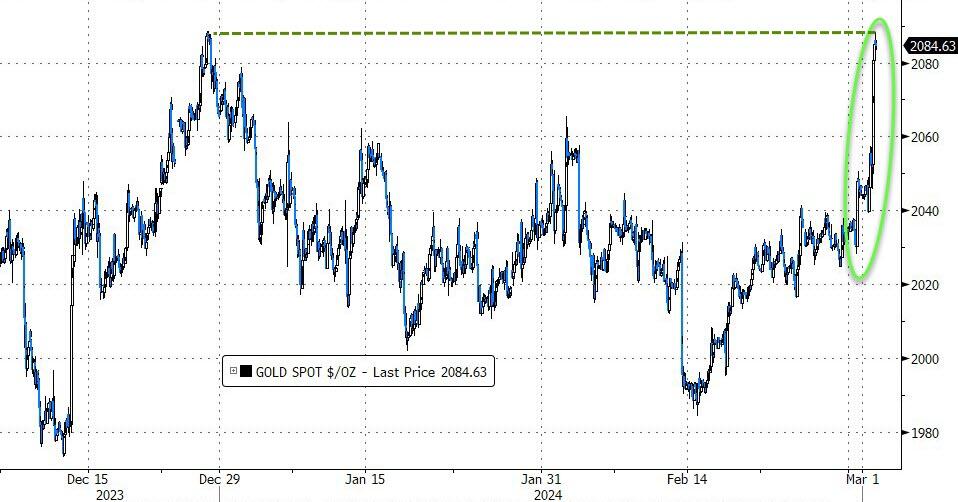
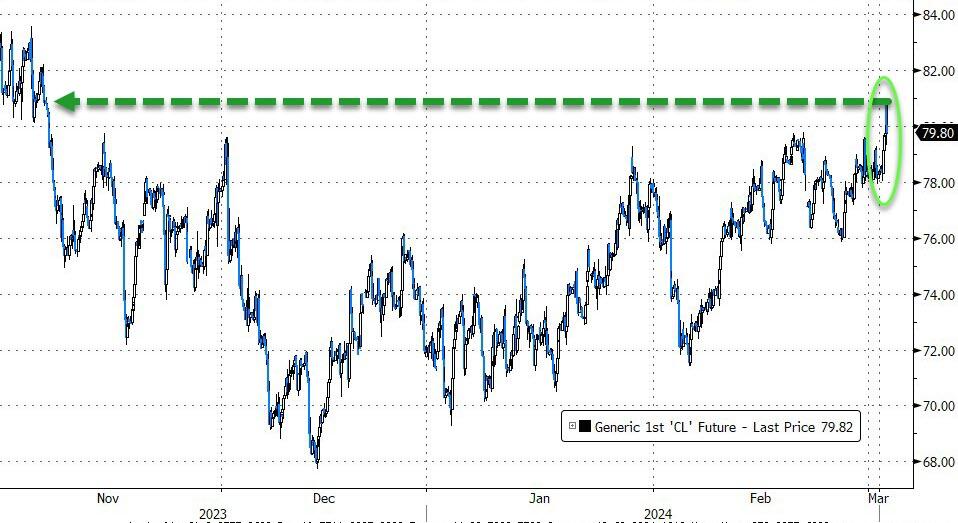
The market rallied across the board: Stocks soared, gold glittered, Treasury yields tumbled (and the yield curve steepened… in a good way), oil surged (and so did crypto, despite its roller-coaster ride).
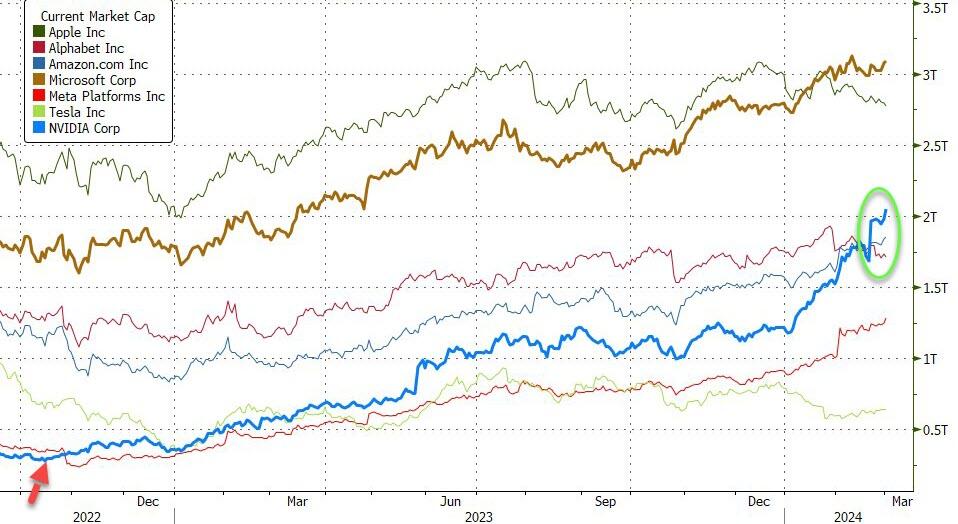
NVDA was the star of the show, closing above $2TN market cap for the first time. To put that in perspective, the company was worth $280BN in Oct 2022. That’s a lot of zeros.
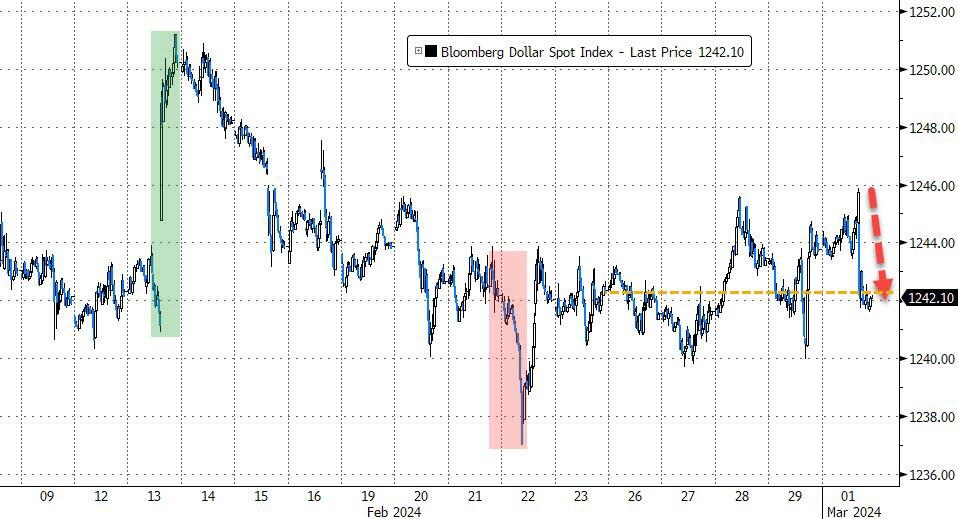
Bond yields also dropped, helping equities along the way, while the dollar weakened, and gold reached its highest level since December. Oil prices also spiked and closed at their highest level since November 6th.
With such a bullish mood, it seems like there is still room for growth, if this chart is anything to go by.
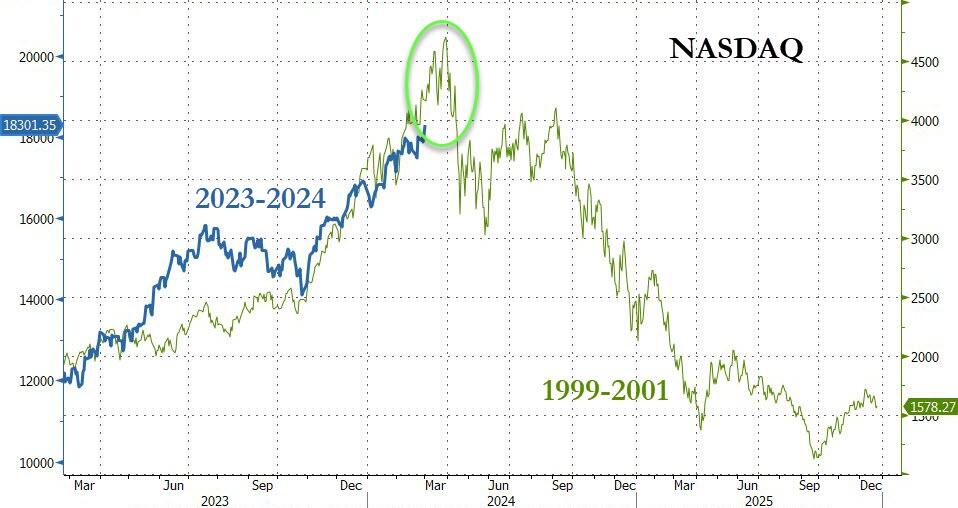
Or is this the calm before the storm?
2. Current “Buy” Cycles (effective 11/21/2023)
Our Trend Tracking Indexes (TTIs) have both crossed their trend lines with enough strength to trigger new “Buy” signals. That means, Tuesday, 11/21/2023, was the official date for these signals.
If you want to follow our strategy, you should first decide how much you want to invest based on your risk tolerance (percentage of allocation). Then, you should check my Thursday StatSheet and Saturday’s “ETFs on the Cutline” report for suitable ETFs to buy.
3. Trend Tracking Indexes (TTIs)
The stock market had a strong performance in February, continuing its upward trend.
Today’s rally was fueled by the Federal Reserve’s announcement of a new policy to reduce its bond holdings and stimulate the economy. This was good news for traders, who reacted positively to the Fed’s move.
Our TTIs also benefited from the market’s momentum and opened the month with gains.
This is how we closed 3/01/2024:
Domestic TTI: +10.19% above its M/A (prior close +9.41%)—Buy signal effective 11/21/2023.
International TTI: +9.35% above its M/A (prior close +8.62%)—Buy signal effective 11/21/2023.
All linked charts above are courtesy of Bloomberg via ZeroHedge.
———————————————————-
WOULD YOU LIKE TO HAVE YOUR INVESTMENTS PROFESSIONALLY MANAGED?
Do you have the time to follow our investment plans yourself? If you are a busy professional who would like to have his portfolio managed using our methodology, please contact me directly to get more details.
—————————————————————-
Contact Ulli