
- Moving the markets
The S&P 500 edged up on the last day of February, as investors shrugged off an inflation report that met expectations and looked at some upbeat consumer spending data.
The Fed’s favorite inflation indicator, the core PCE index, rose by 0.4% in January and 2.8% year-over-year, matching the Dow Jones estimates. The headline PCE index, which includes food and energy, also matched the forecasts, rising by 0.3% monthly and 2.4% annually.
This was good news for the bulls, who feared that inflation would spike and force the Fed to delay or reverse its rate cuts. They came back to the market and lifted the indexes.
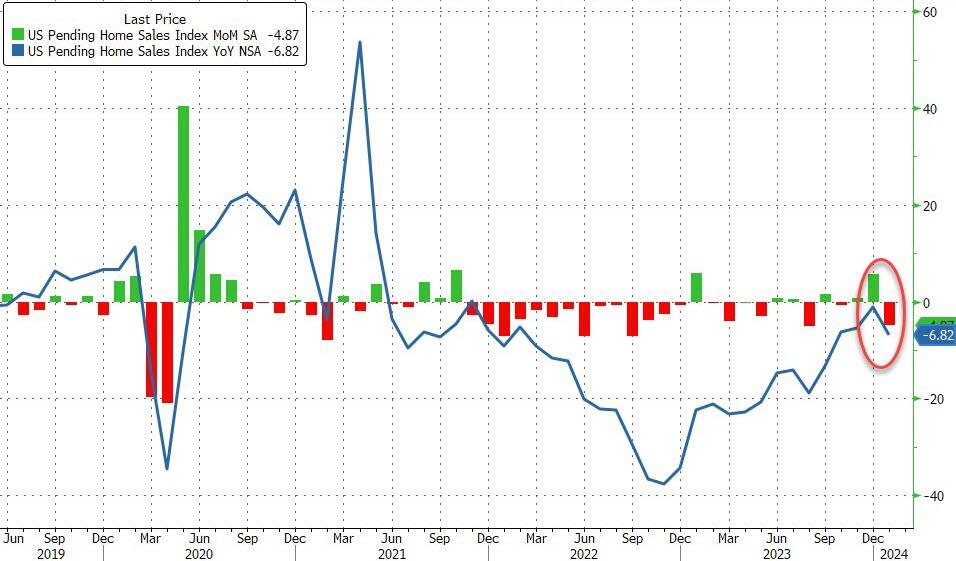
On the other hand, pending home sales disappointed in January, falling by 4.9% instead of rising by 2% as expected. Mortgage rates fluctuated and dampened the demand for houses.
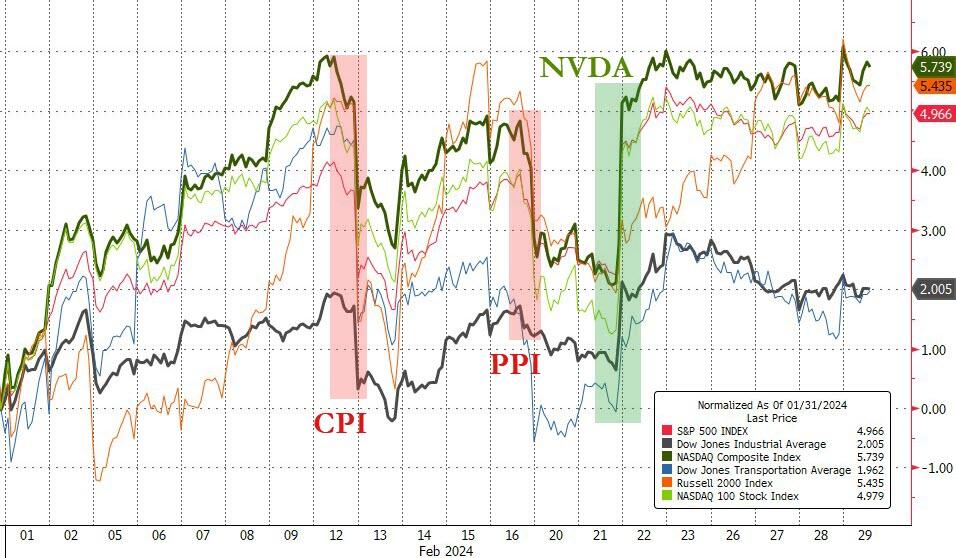
February ended with a green month for the three major averages, despite some recent dips that cast doubt on the durability of the AI-led rally.
ZeroHedge summed up February like this:
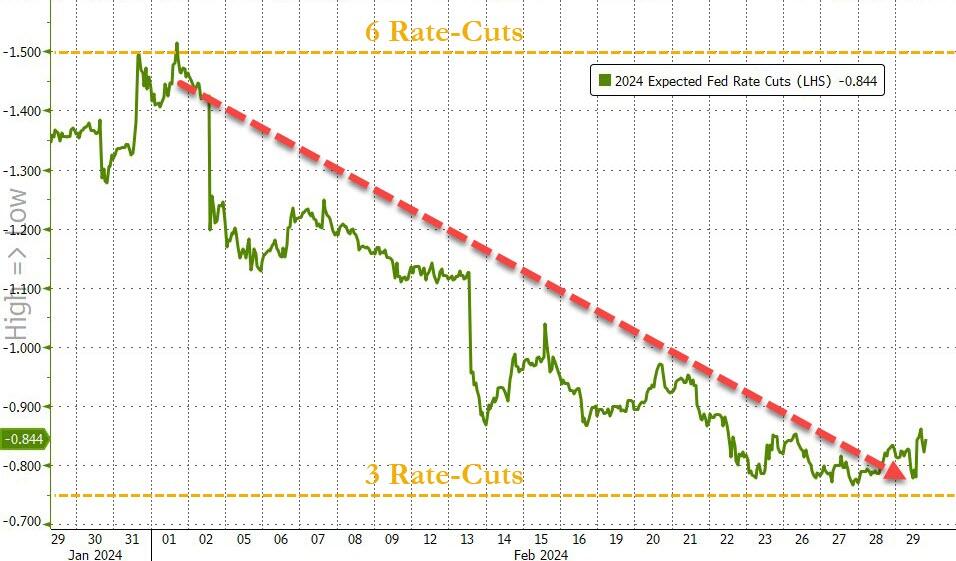
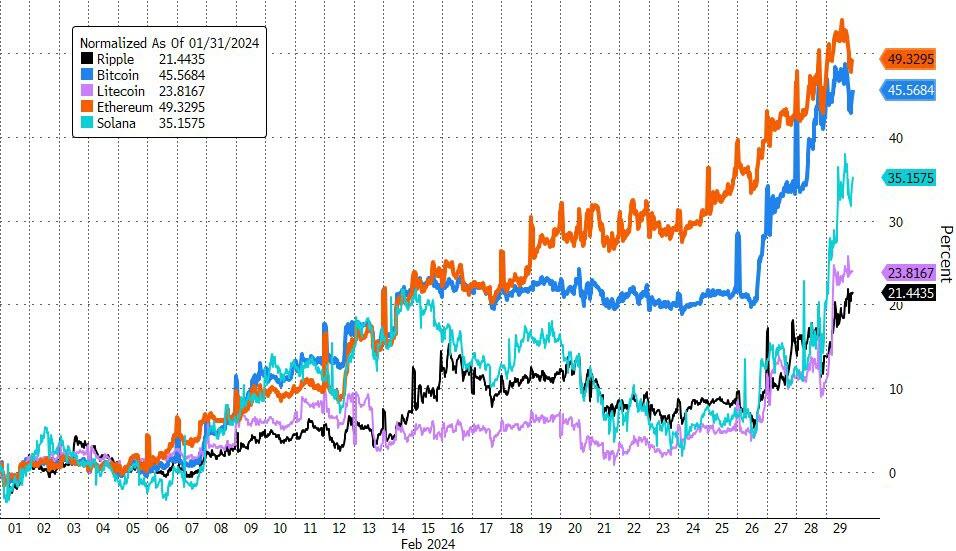
Cryptos rocked, stocks rolled, bonds flopped, and rate-cut hopes dropped.
The odds of a rate cut in March went from 60% to zero, and the odds of a rate cut in May went from 100% to 18%. July is now the most likely month for a rate cut.
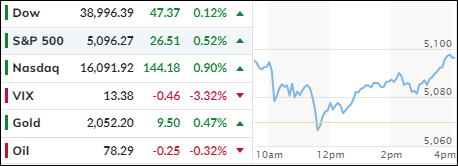
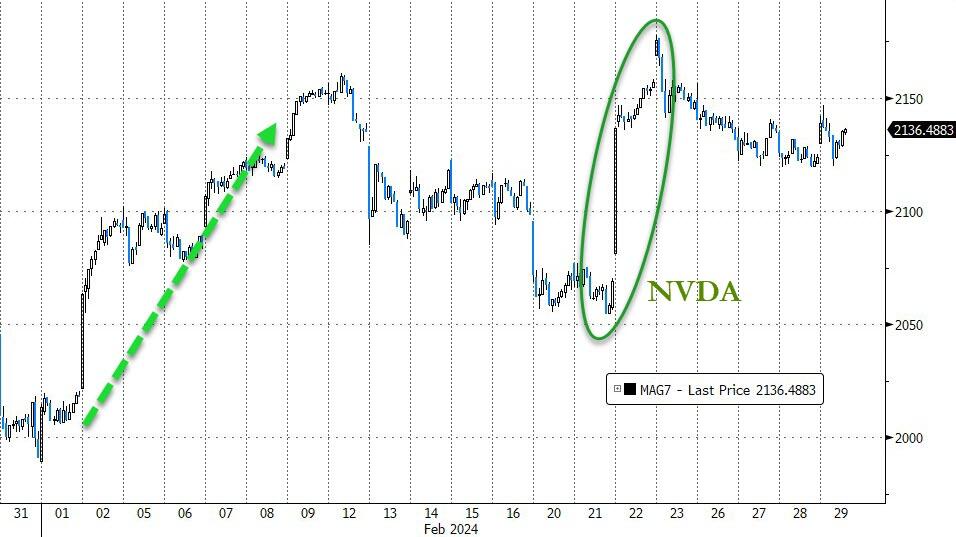
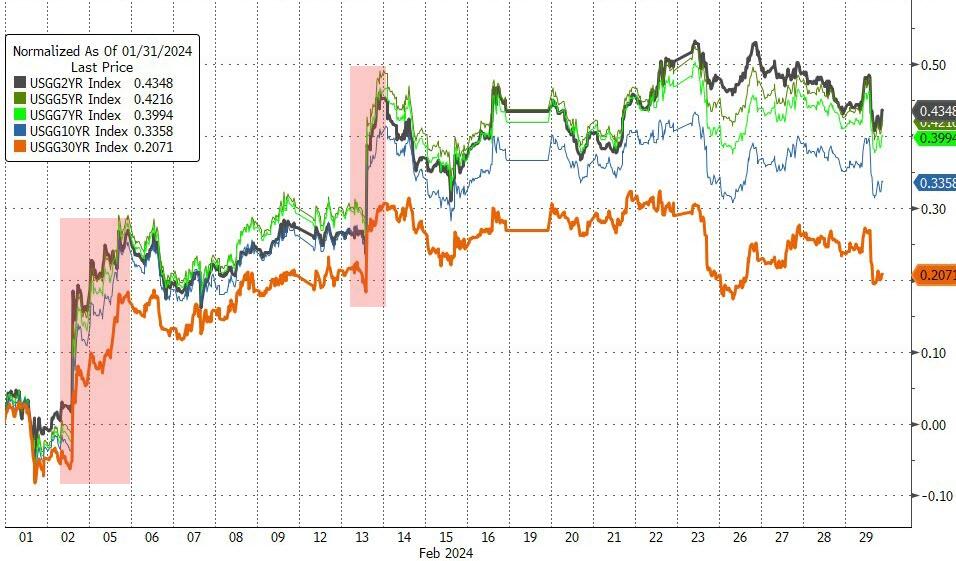
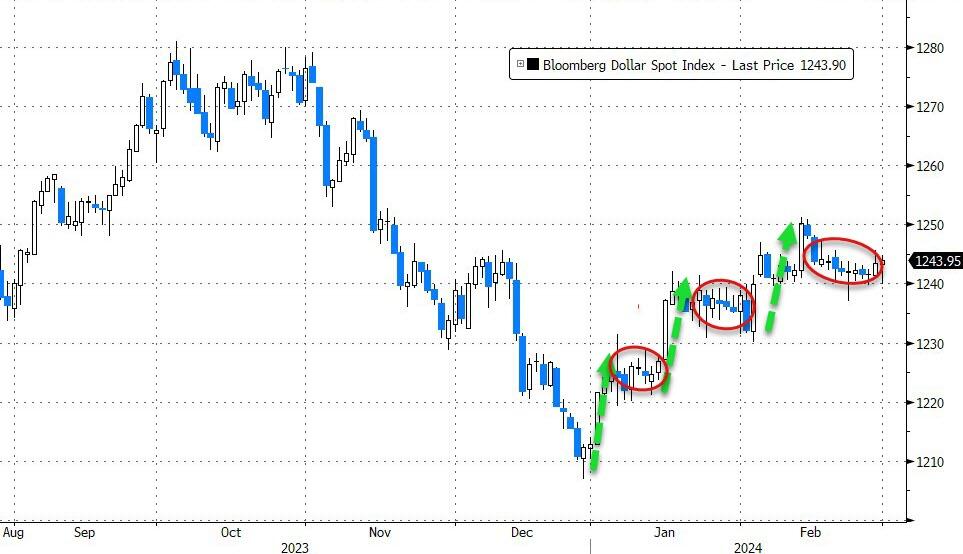
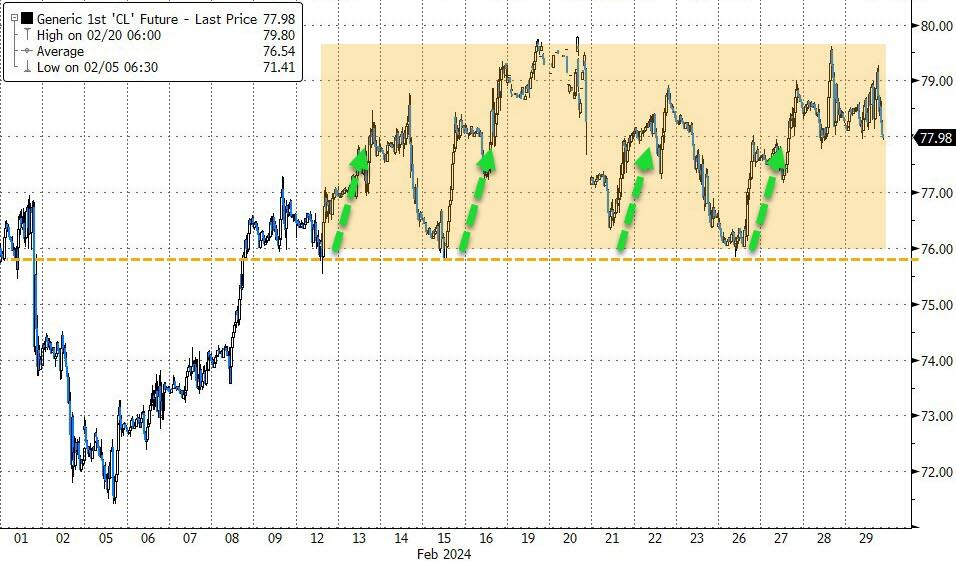
The MAG7 stocks gained more than 7% in February, but they stalled after the initial surge. As the rate-cut hopes faded and the economic data improved, bond yields climbed, the dollar strengthened for the second month in a row, while gold ended February flat. Oil prices rose with WTI nearing $79.
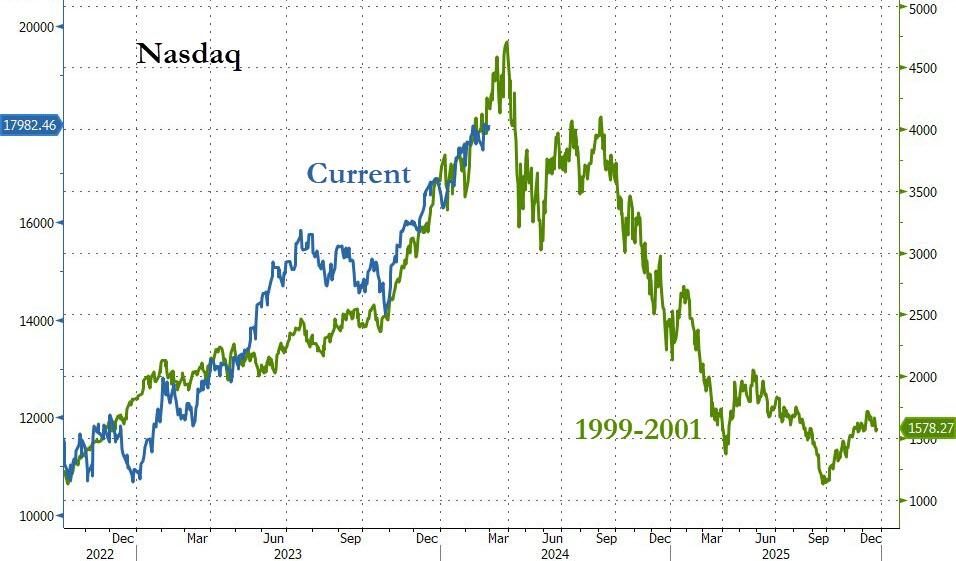
The real action was in crypto, where Ethereum beat Bitcoin (+49% vs. +45%) and the latter almost reached $64,000. The Nasdaq still follows the pattern of 1999-2001, but it raises this question:
Will March be a lion or a lamb?
2. Current “Buy” Cycles (effective 11/21/2023)
Our Trend Tracking Indexes (TTIs) have both crossed their trend lines with enough strength to trigger new “Buy” signals. That means, Tuesday, 11/21/2023, was the official date for these signals.
If you want to follow our strategy, you should first decide how much you want to invest based on your risk tolerance (percentage of allocation). Then, you should check my Thursday StatSheet and Saturday’s “ETFs on the Cutline” report for suitable ETFs to buy.
3. Trend Tracking Indexes (TTIs)
The stock market experienced a brief decline in the middle of the day, but it bounced back and finished the month of February with a slight increase.
Our TTIs also remained strong, especially the one that tracks the U.S. market.
This is how we closed 2/29/2024:
Domestic TTI: +9.41% above its M/A (prior close +8.97%)—Buy signal effective 11/21/2023.
International TTI: +8.62% above its M/A (prior close +8.53%)—Buy signal effective 11/21/2023.
All linked charts above are courtesy of Bloomberg via ZeroHedge.
———————————————————-
WOULD YOU LIKE TO HAVE YOUR INVESTMENTS PROFESSIONALLY MANAGED?
Do you have the time to follow our investment plans yourself? If you are a busy professional who would like to have his portfolio managed using our methodology, please contact me directly to get more details.
—————————————————————-
Contact Ulli