
- Moving the markets
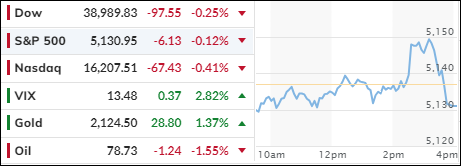
The Dow Jones Industrial Average took a break on Monday after hitting new highs in a rally driven by artificial intelligence stocks. Apple dropped more than 2% after the European Union slapped it with a $2 billion fine for abusing its market power in music streaming.
The Nasdaq Composite, which is loaded with tech stocks, reached a record high on Friday, breaking its previous peak from 2021. It was the last of the major stock indexes to do so this year.
This week, traders will be watching Federal Reserve Chair Jerome Powell for hints on where interest rates are headed. He will give updates on monetary policy to the House on Wednesday and to the Senate on Thursday.
On Wednesday, we will also get some data on the job market, with the ADP Employment Survey and the January job openings report. On Friday, we will see how many jobs were added or lost in February.
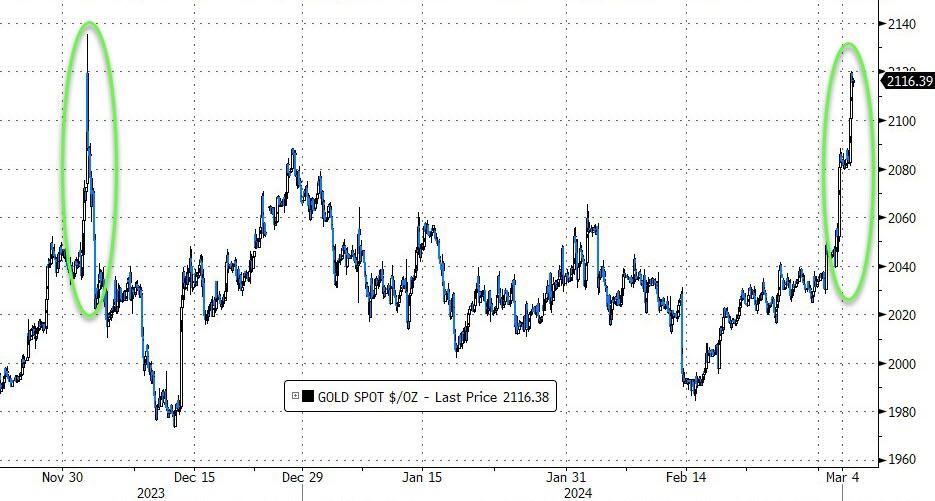
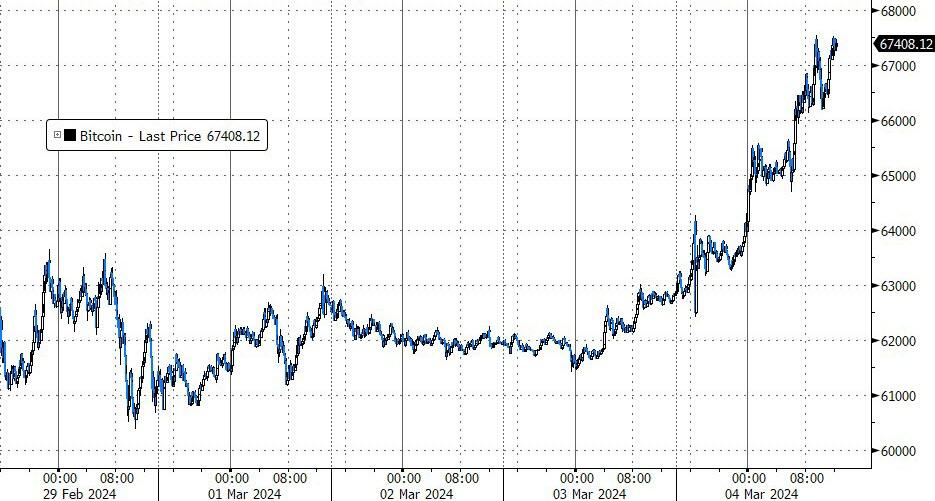
Today, gold and bitcoin shone brightly, reaching new closing highs, as investors expected lower interest rates and more money printing from the Fed. Gold defied the low inflation narrative and bitcoin broke $67,000, eyeing its old record.
Meanwhile, stocks were mostly flat, with small caps rising and falling in sync with the European market. A late sell-off pushed the Nasdaq to the bottom of the pack, making it the worst performer of the day.
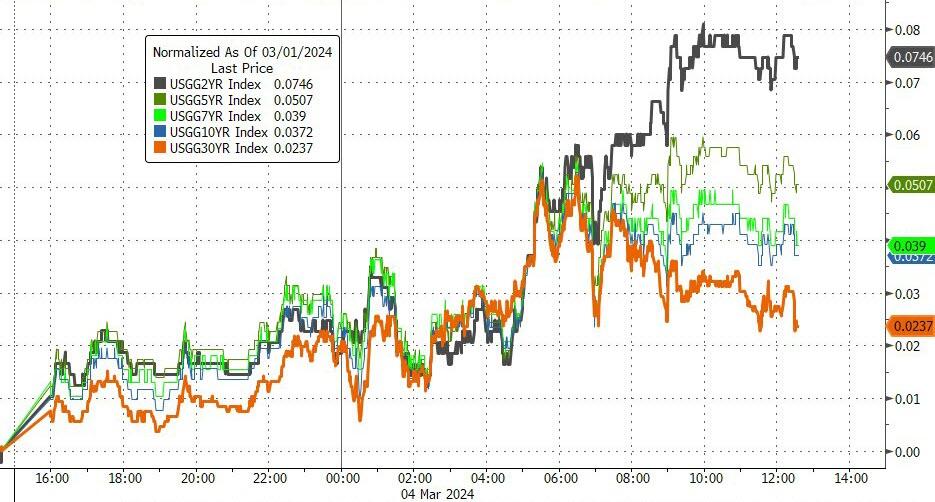
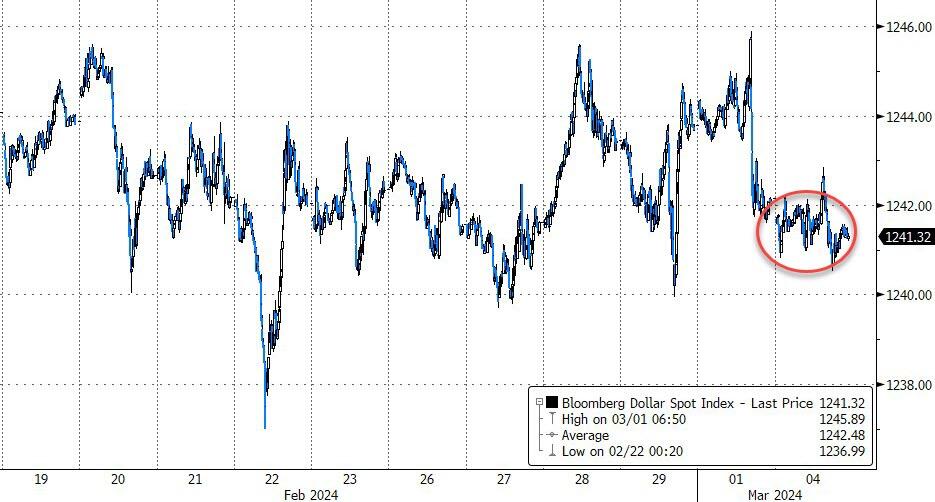
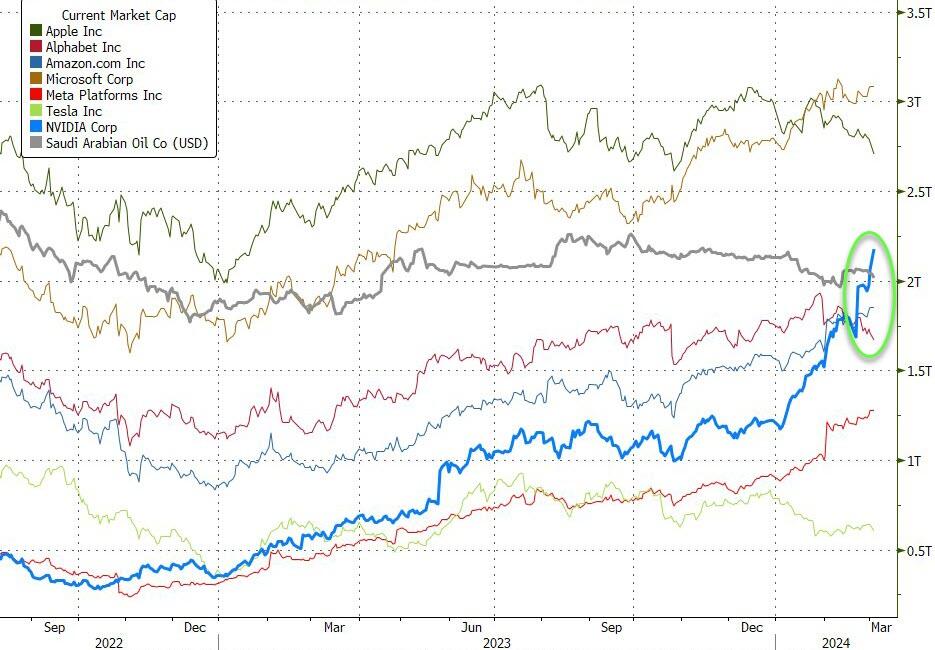
Bond yields went up, the dollar went down, but both stayed within their recent ranges. NVDA, however, kept going up, adding another 6% to its price.
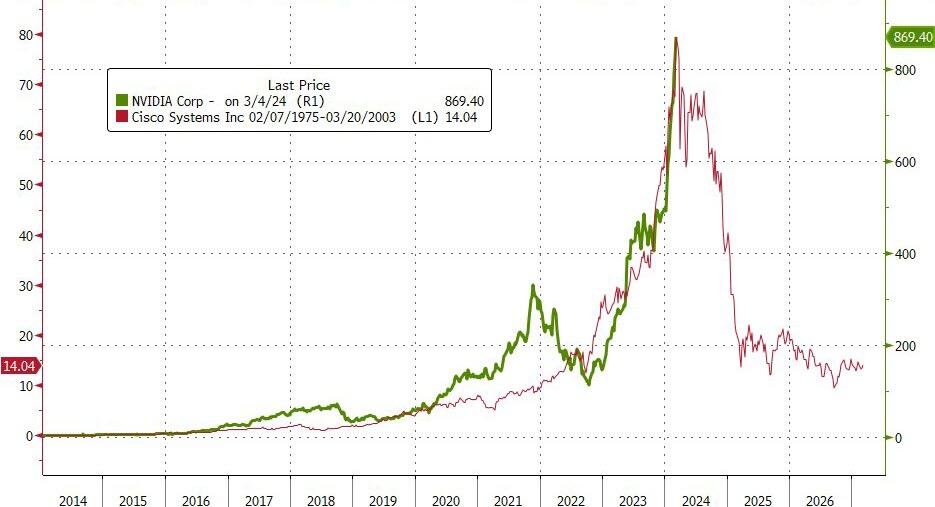
With this surge, NVDA is almost catching up with Cisco’s historical highs.
Will NVDA make history or repeat it?
2. Current “Buy” Cycles (effective 11/21/2023)
Our Trend Tracking Indexes (TTIs) have both crossed their trend lines with enough strength to trigger new “Buy” signals. That means, Tuesday, 11/21/2023, was the official date for these signals.
If you want to follow our strategy, you should first decide how much you want to invest based on your risk tolerance (percentage of allocation). Then, you should check my Thursday StatSheet and Saturday’s “ETFs on the Cutline” report for suitable ETFs to buy.
3. Trend Tracking Indexes (TTIs)
The main stock market indicators showed no clear direction during the trading day and ended with small losses. However, gold and bitcoin performed well and approached their highest prices ever.
Our TTIs remained stable and changed very little.
This is how we closed 3/04/2024:
Domestic TTI: +10.39% above its M/A (prior close +10.19%)—Buy signal effective 11/21/2023.
International TTI: +9.37% above its M/A (prior close +9.35%)—Buy signal effective 11/21/2023.
All linked charts above are courtesy of Bloomberg via ZeroHedge.
———————————————————-
WOULD YOU LIKE TO HAVE YOUR INVESTMENTS PROFESSIONALLY MANAGED?
Do you have the time to follow our investment plans yourself? If you are a busy professional who would like to have his portfolio managed using our methodology, please contact me directly to get more details.
—————————————————————-
Contact Ulli