
- Moving the markets
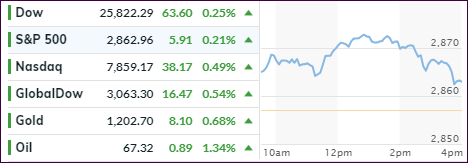
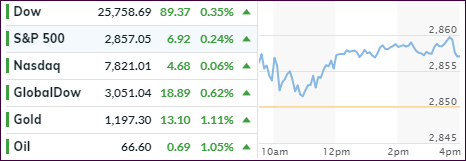
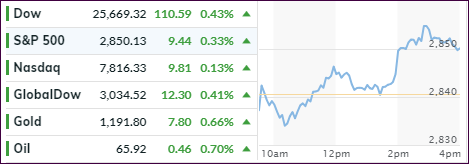
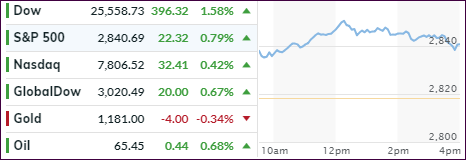
The rally gathered steam and continued for the fourth straight day despite some weakness setting in towards the end of the session. I guess it was a case of the nerves not only due the S&P 500 notching an intra-day record but also gaining on the day when stocks tied the record for longest bull market in history, according to MarketWatch. The Russell 2000 and the Dow transports set records as well.
Despite Trump’s rhetoric to the contrary, optimism still prevails that the US/China trade dispute will be resolved amicably, which has been a supporting factor for equities along with solid corporate earnings.
With earnings season just about being over, a new focal point is needed to provide the ammo for further market advances. With no essential economic data on deck, that focus has been on the Fed, which will release the minutes from their latest meeting tomorrow around lunchtime.
This is followed by a speech from Fed head Powell on Friday, where much hope is put on clarification of some of the potential market headwinds, such as impact of current trade policy, plans for further rate hikes, and the effect of the Turkish currency crises on other emerging markets.
As I am writing this, Trump’s personal lawyer Michael Cohen pleaded guilty to a variety of charges. The futures markets were modestly affected with the major indexes currently giving back some of today’s gains. I don’t think this will be much of a market moving affair, but you can never be sure until we see how this plays out tomorrow.
