
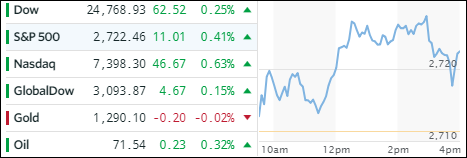
- Moving the markets
When weak data points appear, one way to deal with them is to simply ignore them. That’s what traders did today, as Housing Starts and Permits tumbled in April (-3.7% MoM and -1.78% MoM respectively), although March permits were revised upwards from +1.9% Mom to 3.6% MoM).
This was followed by a plunge of ReFi applications to 10 year lows, thanks to the Fed’s recent rate hikes and the subsequent spike in mortgage rates.
However, these economic data dumps did nothing other than to push the broad markets higher and to also send SmallCaps (Russell 2000) to a record high. The US Macro Surprise Index confirmed that US economic data are the weakest and most disappointing in 7 months (hat tip to ZH for these numbers).
While Treasury bond yields traded in a narrow range, the trend was up with the 10-year yield rising 1 basis point to close at 3.09%. Overcoming these headwinds was a challenge that traders managed to handle well, at least for today, by keeping the bullish theme alive. However, should the bond yield spike continue unabated, we will run into a scenario that will simply be no longer sustainable for the bullish cause.
- ETFs in the Spotlight
In case you missed the announcement and description of this section, you can read it here again.
It features 10 broadly diversified and sector ETFs from my HighVolume list as posted every Saturday. Furthermore, they are screened for the lowest MaxDD% number meaning they have been showing better resistance to temporary sell offs than all others over the past year.
The below table simply demonstrates the magnitude with which some of the ETFs are fluctuating in regards to their positions above or below their respective individual trend lines (%M/A). A break below, represented by a negative number, shows weakness, while a break above, represented by a positive percentage, shows strength.
For hundreds of ETF choices, be sure to reference Thursday’s StatSheet.
Year to date, here’s how our candidates have fared so far:
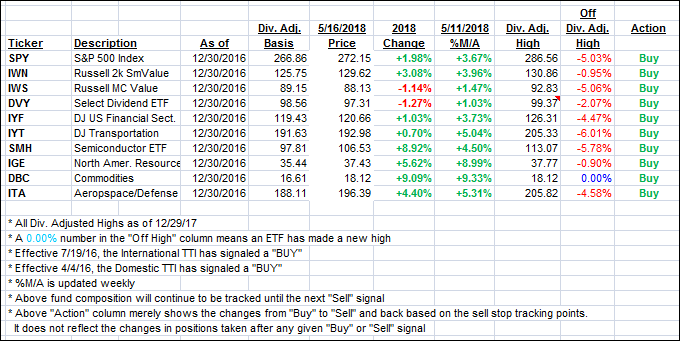
Again, the %M/A column above shows the position of the various ETFs in relation to their respective long term trend lines, while the trailing sell stops are being tracked in the “Off High” column. The “Action” column will signal a “Sell” once the -7.5% point has been taken out in the “Off High” column.
- Trend Tracking Indexes (TTIs)
Our Trend Tracking Indexes (TTIs) edged higher as the market rebounded from yesterday’s spanking.
Here’s how we closed 05/16/2018:
Domestic TTI: +2.00% above its M/A (last close +1.78%)—Buy signal effective 4/4/2016
International TTI: +2.49% below its M/A (last close +2.39%)—Buy signal effective 7/19/2016
Disclosure: I am obliged to inform you that I, as well as my advisory clients, own some of the ETFs listed in the above table. Furthermore, they do not represent a specific investment recommendation for you, they merely show which ETFs from the universe I track are falling within the guidelines specified.
Contact Ulli