Taking A Breather

Ulli Market Commentary Contact

[Chart courtesy of MarketWatch.com]
  1. Moving the markets

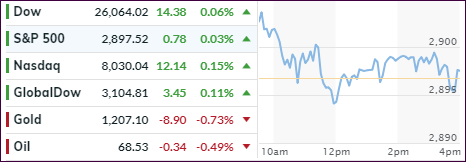
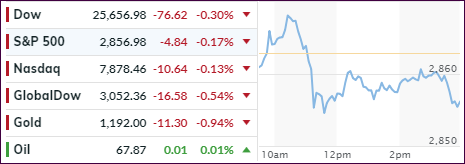
It comes as no surprise that, after yesterday’s strong run-up, the major indexes took a bit of a breather, however, they still managed to close in the green, despite dipping below the unchanged line several times during the session.

So far, it looks that this month may turn out to be the second-best August since 2009, a very interesting occurrence, especially when considering the ever widening gap between the S&P 500 and the collapse of US economic data, which is hardly awe inspiring (hat tip to ZH for these charts).

So, the markets appear to be driven by other factors, and not sound fundamentals. Today, a small assist came from a measure of consumer confidence that hit a nearly 18-year high and was an exception to the slumping data points of the recent past.

The foreign currency debacle continued today led by the Turkish lira plunging -2.35%. This escalated predominantly in the Latin American countries as this chart shows. However, the shakeup was not big enough to make the headlines nor did it affect domestic equities.

Nevertheless, after a slow start, stocks came alive during the second half of August and put in a good performance, despite this being the dog days of summer. With only 3 trading days left, let’s see if traders’ appetites remain bullish.

Read More

Equities Shift Into Overdrive

Ulli Market Commentary Contact

[Chart courtesy of MarketWatch.com]
  1. Moving the markets

So much for the dog days of summer, as the S&P 500 and Nasdaq closed at record highs for the second day in a row powered by excitement over the new trade deal between the US and Mexico.

The Dow successfully reclaimed the 26k level for the first time since February, while the Nasdaq conquered the 8k milestone, which took only some 5 months to accomplish after the 7k landmark was breached. This makes it the second 1,000-point advance this year, a feat last seen in 1999.

While the new trade deal with our southern neighbor sparked today’s solid advance, optimism from Friday’s Fed announcement that they would “continue its strategy of gradually normalizing its monetary policy,” carried over into today’s session and contributed to the bullish mood.

Additionally, traders are convinced that the economy remains on solid footing, which helped them disregard a variety of headwinds ranging from signs of a weakening housing market, negative headlines, emerging market currency crises and the ever-present trade policy uncertainty.

Interest rates rose with bond yields crawling higher, as the decoupling of the stock market and bond market continues, but the 30-year remains below the 3% level. After peaking mid-August, the US Dollar continued doing an about face by having retreated to the level where it started the month.

Goldman Sachs shed some light as why the markets ripped higher in August. They pointed out that August is typically the busiest month for corporate buy-backs when measured over the last decade. And I thought it was the resilient economy…

Read More

ETFs On The Cutline – Updated Through 08/24/2018

Ulli ETFs on the Cutline Contact

Below, please find the latest High-Volume ETF Cutline report, which shows how far above or below their respective long-term trend lines (39-week SMA) my currently tracked ETFs are positioned.

This report covers the HV ETF Master List from Thursday’s StatSheet and includes 366 High Volume ETFs ETFs, defined as those with an average daily volume of more than $5 million, of which currently 188 (last week 162) are hovering in bullish territory. The yellow line separates those ETFs that are positioned above their trend line (%M/A) from those that have dropped below it.

Take a look:

The HV ETF Master Cutline Report

In case you are not familiar with some of the terminology used in the reports, please read the Glossary of Terms.

If you missed the original post about the Cutline approach, you can read it here.

ETF Tracker Newsletter For August 24, 2018

Ulli ETF Tracker Contact

ETF Tracker StatSheet

https://theetfbully.com/2018/08/weekly-statsheet-for-the-etf-tracker-newsletter-updated-through-08-23-2018/

TESTING RECORD HIGHS

[Chart courtesy of MarketWatch.com]
  1. Moving the markets

In the face of the worst durable goods order report in 6 months, indicating an accelerating US slowdown, the S&P and Nasdaq moved into record territory with the broad market showing a solid performance as well.

Apparently, weak economic reports, including the ones on housing recently, mean nothing compared to the impact the words of the Fed head Powell have. During the annual Jackson Hole meeting in Wyoming, which will extend into this weekend, Powell affirmed the Central Bank’s strategy that the plan to gradually normalize monetary policy will remain intact.

But, he also noted a couple of risks with further rate hikes and described these as “moving too fast and needlessly shortening the expansion, versus moving too slowly and risking a destabilizing overheating.” He ended with “I see the current path of gradually raising interest rates as the [Federal Reserve’s] approach to taking seriously both of these risks.”

This kind of reassurance, that the Fed appears to have discovered the perfect balance, pleased the markets and up we went across the board. What struck me as strange was the fact that he did not mention inflationary threats at all, as if they were non-existent. Go figure…

Even news headlines about elevated trade tensions with China, as the latest round of talks did not produce any results, could not disturb the downright sanguine mood on Wall Street. And neither did the latest legal issues of President Trump.

For a change, the much beaten up Chines Yuan staged a comeback rally, as the dollar took a dive, which in turned helped gold show signs of live with the yellow metal gaining +1.54% to $1,212, which was its best close since March. The dollar’s weakness also helped commodities (DBC) to a green weekly close.

Overall, it was a good week for equities, especially given the fact that we’re nearing the end of summer, which is a notoriously slow period for the markets. This year appears to be different.

Read More

Weekly StatSheet For The ETF Tracker Newsletter – Updated Through 08/23/2018

Ulli Uncategorized Contact

ETF Data updated through Thursday, August 23, 2018

Methodology/Use of this StatSheet:

  1. From the universe of over 1,800 ETFs, I have selected only those with a trading volume of over $5 million per day (HV ETFs), so that liquidity and a small bid/ask spread are assured.
  2. Trend Tracking Indexes (TTIs)

Buy or Sell decisions for Domestic and International ETFs (section 1 and 2), are made based on the respective TTI and its position either above or below its long-term M/A (Moving Average). A crossing of the trend line from below accompanied by some staying power above constitutes a “Buy” signal. Conversely, a clear break below the line constitutes a “Sell” signal. Additionally, I use a 7.5% trailing stop loss on all positions in these categories to control downside risk.

  1. All other investment arenas do not have a TTI and should be traded based on the position of the individual ETF relative to its own respective trend line (%M/A). That’s why those signals are referred to as a “Selective Buy.” In other words, if an ETF crosses its own trendline to the upside, a “Buy” signal is generated. Since these areas tend to be more volatile, I recommend a wider trailing sell stop of 7.5% -10% depending on your risk tolerance.

If you are unfamiliar with some of the terminology, please see Glossary of Terms and new subscriber information in section 9.


  1. DOMESTIC EQUITY ETFs: BUY — since 4/4/2016

Click on chart to enlarge

Our main directional indicator, the Domestic Trend Tracking Index (TTI-green line in the above chart) is positioned above its long-term trend line (red) by +2.84% after having generated a new Domestic Buy signal effective 4/4/2016 as posted.

Read More

Struggling For Direction

Ulli Market Commentary Contact

[Chart courtesy of MarketWatch.com]
  1. Moving the markets

An early rally fizzled out mid-day with the major indexes suddenly tanking and closing modestly in the red. Today’s session had the feel of a typical summer day with volume disappearing causing the S&P sectors to trade lower and directionless.

However, the object in focus that may impact markets tomorrow is the annual meeting of the bankers in Jackson Hole, WY where Fed head Powell will be the most watched and analyzed speaker.

I don’t think any more earthshaking news will be forthcoming other than what yesterday’s minutes from the last meeting revealed. But, the anxious crowd hopes for more clarity. Hmm, the details I outlined yesterday couldn’t be any clearer…

On the economic data front, 2 more bad reports surfaced. New home sales took a hit by falling to a 9-month low, while manufacturing tumbled, missed expectations and dropped for the 3rd month in a row.

ZH featured some worthwhile charts that show some of the current decoupling of a variety of important indexes.

  1. Chinese Yuan and US stocks
  2. Bonds and US Stocks
  3. Yield Curve and US Stocks
  4. Commodities and US Stocks
  5. World Stocks and US Stocks
  6. Macro and US Stocks
  7. Global Central Bank Balance Sheets and US Stocks

So, what do these charts mean? They simply show that things are out of sync and eventually will adjust themselves and recouple. As always, no one has the answer as to which direction the adjustment will play out; we simply must be patient and observe the developments and see if any of them will affect our Trend Tracking Indexes (TTIs).

Read More