
- Moving the markets
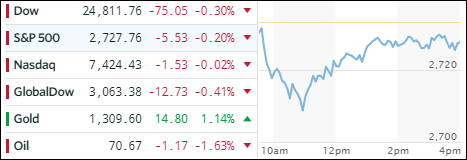
The Major Indexes took a steep dive right after the opening bell caused by geopolitical concerns, as President Trump canceled the widely anticipated summit with N. Korea’s Kim Jong Un. The reason given was alleged “open hostility” from the country.
Not helping matters was weakness in the energy sector (-1.7%) and in financials (-0.7%). However, the markets found a bottom at mid-morning thanks to dip-buyers, which was followed by a slow climb back towards the unchanged line. Even though we fell short, the early morning losses were sharply reduced.
Far more concerning to me is the state of affairs of Deutsche Bank (DB), the largest derivatives holder in the world with over $50 trillion, while the market capitalization of the bank has dwindled down to some $22 billion. Why is that important?
The bank appears to be crumbling with its stock price now approaching the critical $10 level and that in the face of an upcoming possible S&P downgrade within the next couple of weeks. A downgrade could put the bank in danger of collapsing, which would have a ripple effect around the world as this bank has huge systemic risk. Take a look at this chart and be amazed as to which institutions might be affected…
Interest rates continued to do an about face with the 10-year bond yield slipping not just 3 basis points to 2.98% but closing below the psychologically important line in the sand, namely the 3% level. Whether this current down trend will continue or not is anybody’s guess, but if it does, it certainly could give a boost to equities.
- ETFs in the Spotlight
In case you missed the announcement and description of this section, you can read it here again.
It features 10 broadly diversified and sector ETFs from my HighVolume list as posted every Saturday. Furthermore, they are screened for the lowest MaxDD% number meaning they have been showing better resistance to temporary sell offs than all others over the past year.
The below table simply demonstrates the magnitude with which some of the ETFs are fluctuating in regards to their positions above or below their respective individual trend lines (%M/A). A break below, represented by a negative number, shows weakness, while a break above, represented by a positive percentage, shows strength.
For hundreds of ETF choices, be sure to reference Thursday’s StatSheet.
Year to date, here’s how our candidates have fared so far:
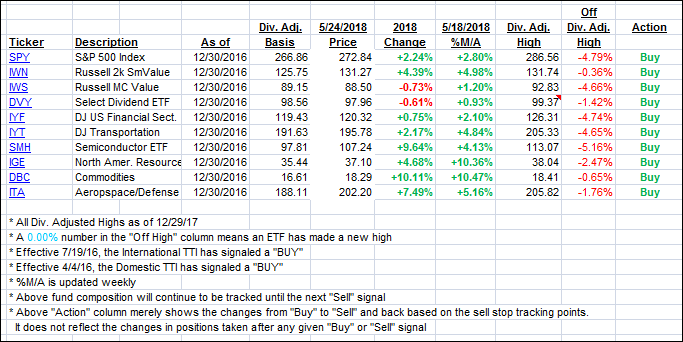
Again, the %M/A column above shows the position of the various ETFs in relation to their respective long term trend lines, while the trailing sell stops are being tracked in the “Off High” column. The “Action” column will signal a “Sell” once the -7.5% point has been taken out in the “Off High” column.
- Trend Tracking Indexes (TTIs)
Our Trend Tracking Indexes (TTIs) slipped a bit as a mid-day rally limited losses for the major indexes.
Here’s how we closed 05/24/2018:
Domestic TTI: +2.04% above its M/A (last close +2.06%)—Buy signal effective 4/4/2016
International TTI: +1.91% below its M/A (last close +2.15%)—Buy signal effective 7/19/2016
Disclosure: I am obliged to inform you that I, as well as my advisory clients, own some of the ETFs listed in the above table. Furthermore, they do not represent a specific investment recommendation for you, they merely show which ETFs from the universe I track are falling within the guidelines specified.
Contact Ulli