
ETF Tracker StatSheet
CRUDE OIL TUMBLES AND MAJOR INDEXES SLIP
- Moving the markets
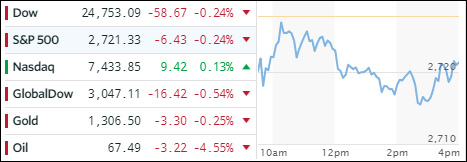
Crude oil took a dive today (-4.5%) as reports that OPEC, along with other major players in this arena, may increase production by as much as $1 million barrels a day. The energy sector followed suit with XLE dropping -2.6% for the session and -4.5% for the week.
The major indexes fared better despite having a see-saw week and, while slipping today, managed to eke out some small gains for the past 5 trading days by adding +0.2% (Dow), +0.3% (S&P) and 1.1% (Nasdaq).
Geopolitical headlines dominated, and it appears that the U.S./N. Korea summit may be back on after Trump’s cancellation yesterday. There was no impact on market behavior during today’s session as this on/off cycle now appears meaningless and may be repeated several more times.
Turmoil in other markets continues, especially in bonds where the bears, betting on higher rates, have been slaughtered recently as 10-year yields, which made a high of 3.11%, suddenly turned around and headed south closing today at 2.93%.
And the trouble in Europe took center stage with ZeroHedge reporting Italy as the biggest headline maker:
- Italian stocks worst week since Nov 2016 (US election)
- Italian stocks worst two-week drop Jun 2016 (Brexit)
- Italian banks worst week since Jun 2016 (Brexit)
- Italian 2Y Spread to Bunds biggest spike since July 2012
- Italian redenomination risk biggest spike ever to record high…
As I said before, events from Europe, as well as negative developments from Deutsche Bank (DB), have the ability to affect markets and interest rates in the U.S. For example, European banks had a downright ugly week, which caused their U.S. counterparts to suffer as well although to a lesser degree.
What caused this sudden reversal in bond yields? No one has the answer yet, but it could be, just maybe, that the widely proclaimed strength in the U.S. economy is not what it’s cracked up to be. It certainly is a possibility motivating the Fed to ease up a bit on its intention of higher rates, and letting inflation shoot past its intended 2% target in order to not negatively impact the economy.
We’ll have to be patient and wait for the outcome. In the meantime, I hope you’re having a great and relaxing Memorial weekend.
- ETFs in the Spotlight
In case you missed the announcement and description of this section, you can read it here again.
It features 10 broadly diversified and sector ETFs from my HighVolume list as posted every Saturday. Furthermore, they are screened for the lowest MaxDD% number meaning they have been showing better resistance to temporary sell offs than all others over the past year.
The below table simply demonstrates the magnitude with which some of the ETFs are fluctuating in regards to their positions above or below their respective individual trend lines (%M/A). A break below, represented by a negative number, shows weakness, while a break above, represented by a positive percentage, shows strength.
For hundreds of ETF choices, be sure to reference Thursday’s StatSheet.
Year to date, here’s how our candidates have fared so far:
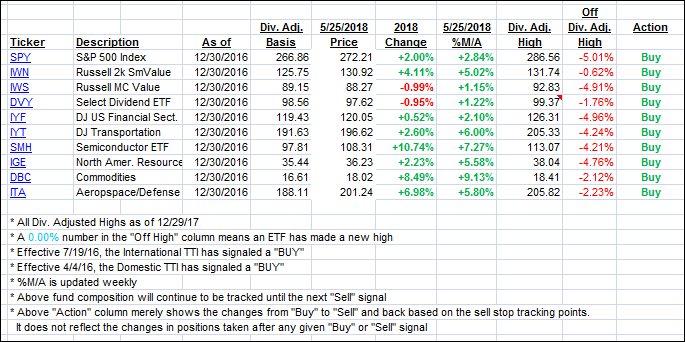
Again, the %M/A column above shows the position of the various ETFs in relation to their respective long term trend lines, while the trailing sell stops are being tracked in the “Off High” column. The “Action” column will signal a “Sell” once the -7.5% point has been taken out in the “Off High” column.
- Trend Tracking Indexes (TTIs)
Our Trend Tracking Indexes (TTIs) headed south with the International one now showing more weakness than the Domestic one.
Here’s how we closed 05/25/2018:
Domestic TTI: +1.85% above its M/A (last close +2.04%)—Buy signal effective 4/4/2016
International TTI: +1.48% below its M/A (last close +1.91%)—Buy signal effective 7/19/2016
Disclosure: I am obliged to inform you that I, as well as my advisory clients, own some of the ETFs listed in the above table. Furthermore, they do not represent a specific investment recommendation for you, they merely show which ETFs from the universe I track are falling within the guidelines specified.
————————————————————-
READER Q & As
All Reader Q & A’s are listed at our web site!
Check it out at:
https://theetfbully.com/questions-answers/
———————————————————-
WOULD YOU LIKE TO HAVE YOUR INVESTMENTS PROFESSIONALLY MANAGED?
Do you have the time to follow our investment plans yourself? If you are a busy professional who would like to have his portfolio managed using our methodology, please contact me directly or get more details at:
https://theetfbully.com/personal-investment-management/
———————————————————
Back issues of the ETF/No Load Fund Tracker are available on the web at:
https://theetfbully.com/newsletter-archives/
Contact Ulli