ETF Tracker Newsletter For March 29, 2019

Ulli ETF Tracker Contact

ETF Tracker StatSheet

https://theetfbully.com/2019/03/weekly-statsheet-for-the-etf-tracker-newsletter-updated-through-03-28-2019/

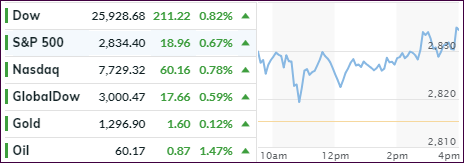
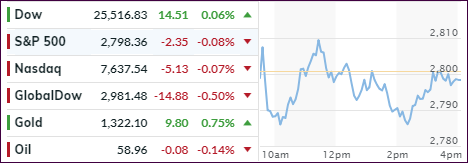
ENDING THE QUARTER ON A POSITIVE NOTE

[Chart courtesy of MarketWatch.com]
  1. Moving the markets

Continued optimism about more progress with the U.S.-China trade talks moved to front and center thereby pushing concerns over slowing global economies to the sidelines, at least for the time being.

Supporting the early rally was the market debut of Uber competitor LYFT, whose shares ended up trading at a market premium of 20% of what they were priced Thursday evening.

This bullish mood accelerated throughout the day with the major indexes picking up steam and closing at the highs of the day.

While the S&P 500 recorded its strongest quarter in a decade (+13.3%), let’s not forget that this comes after a devastating Q4 2018 performance of -13.5%, during which the Fed suddenly changed course by softening their interest rate policy thereby bailing out the Buy-and-Hold crowd and likely saving investors’ portfolios from far more serious destruction.

Ironically, all this occurred in the face of plunging bond yields and a surge in global money supply, while fundamental data, as represented by the Macro Surprise Index, simply tumbled.

But today, we also heard some positive econ reports during which we learned that consumer confidence rebounded and improved for the second straight month. At the same time, the pummeled real estate sector showed signs of life, as new home sales surged thanks to tumbling mortgage rates.

Earnings season will be on deck starting next week and will likely give us a better view not only if bullish forces are alive and well, but also if the markets have enough starch to weather out disappointments, which are sure to be part of the story line.
Read More

Weekly StatSheet For The ETF Tracker Newsletter – Updated Through 03/28/2019

Ulli ETF StatSheet Contact

ETF Data updated through Thursday, March 28, 2019

Methodology/Use of this StatSheet:

  1. From the universe of over 1,800 ETFs, I have selected only those with a trading volume of over $5 million per day (HV ETFs), so that liquidity and a small bid/ask spread are assured.
  2. Trend Tracking Indexes (TTIs)

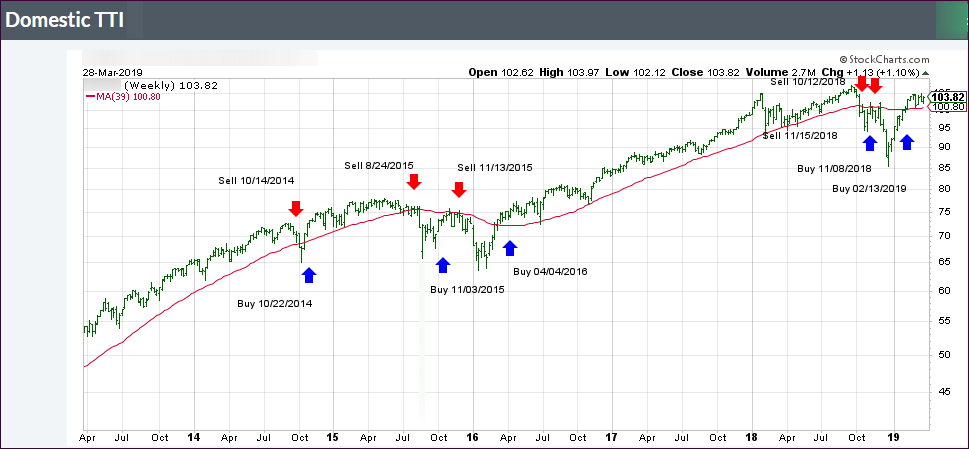
Buy or Sell decisions for Domestic and International ETFs (section 1 and 2), are made based on the respective TTI and its position either above or below its long-term M/A (Moving Average). A crossing of the trend line from below accompanied by some staying power above constitutes a “Buy” signal. Conversely, a clear break below the line constitutes a “Sell” signal. Additionally, I use a 7.5% trailing stop loss on all positions in these categories to control downside risk.

  1. All other investment arenas do not have a TTI and should be traded based on the position of the individual ETF relative to its own respective trend line (%M/A). That’s why those signals are referred to as a “Selective Buy.” In other words, if an ETF crosses its own trendline to the upside, a “Buy” signal is generated. Since these areas tend to be more volatile, I recommend a wider trailing sell stop of 7.5% -10% depending on your risk tolerance.

If you are unfamiliar with some of the terminology, please see Glossary of Terms and new subscriber information in section 9.


  1. DOMESTIC EQUITY ETFs: BUY — since 02/13/2019

Click on chart to enlarge

Our main directional indicator, the Domestic Trend Tracking Index (TTI-green line in the above chart) is now positioned above its long-term trend line (red) by +3.07% after having generated a new Domestic “Buy” signal effective 2/13/19 as posted.

Read More

Trade Hope Keeps The Bullish Theme Alive

Ulli Market Commentary Contact

[Chart courtesy of MarketWatch.com]
  1. Moving the markets

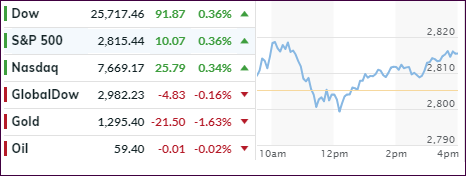
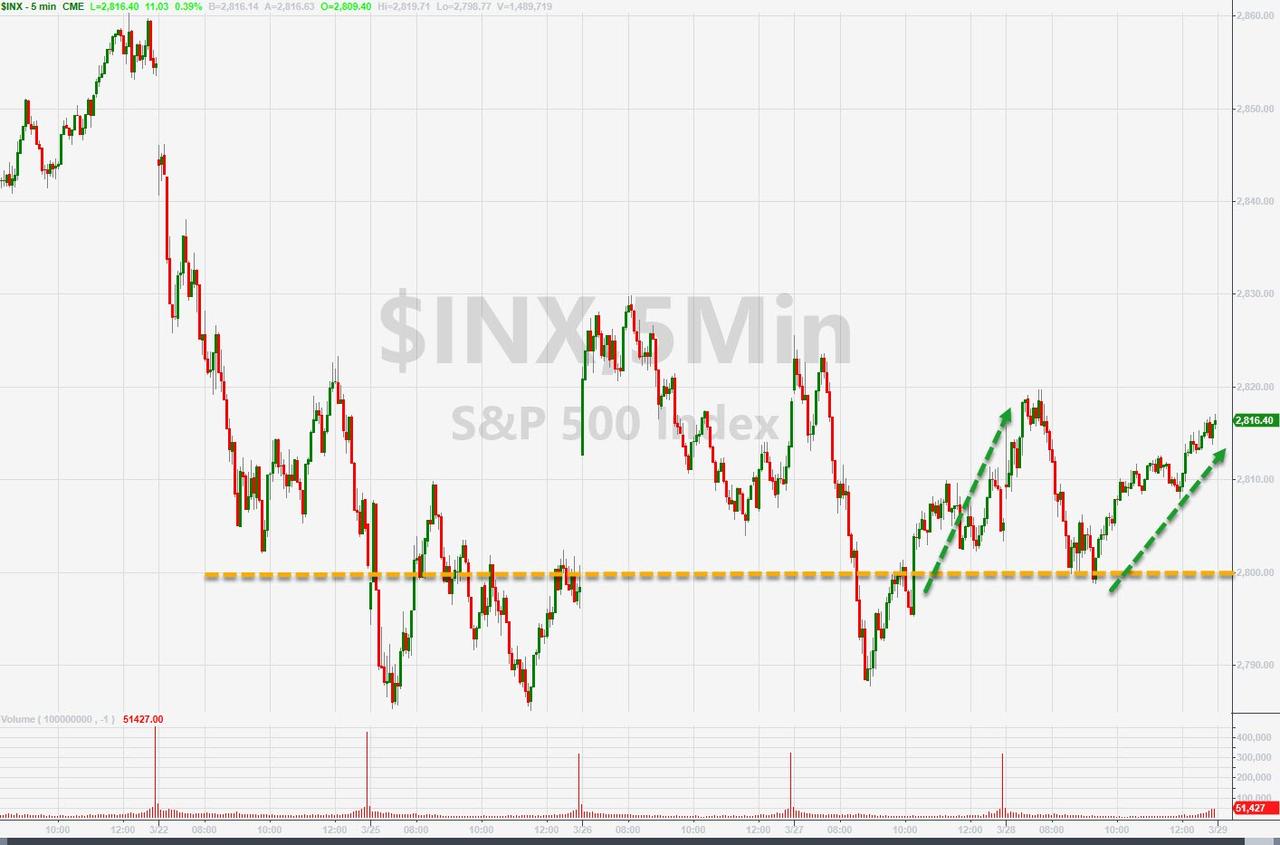
An early bounce gave way to selling with the S&P 500 touching its hard fought 2,800 level, before bullish sentiment prevailed and pulled all 3 major indexes out of the doldrums and into a green close.

Nevertheless, it was a choppy session with support coming from the dangling trade carrot which, on many occasions, has successfully supported and bailed out the bulls. Today was no different in that reports announced that “new progress toward a trade deal” had been made based on “unprecedented proposals” to resolve the long-running dispute.

Keeping the rebound in check was the revision that the U.S. economy grew at a slower 2.2% in Q4 2018 vs. the initial 2.6% estimate. However, even with this adjustment, GDP for all of 2018 came in at 2.9% matching 2015 for best performance since the Great Recession 10 years ago.

With bond yields having been clobbered, the beneficiary turned out to be mortgage rates with the 30-year now down to 4.37% on average vs. 4.54% in 2018. On the other hand, housing numbers have shown anything but greatness in that sector with the latest victim being pending home sales, which tumbled 4.9% YoY, their 14th straight month of declines.

We continue to be stuck in a sideways pattern, but I think we’ll see more clarity regarding the direction of the major trend once earnings season gets underway next week.

Read More

Bears Trump Bulls

Ulli Market Commentary Contact

[Chart courtesy of MarketWatch.com]
  1. Moving the markets

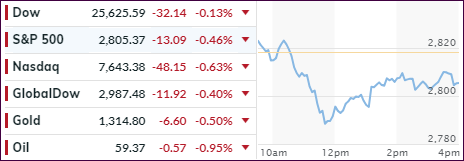
While the major indexes opened in the green, the time spent above their respective unchanged lines was cut short, as sellers took charge and drove equities straight south supported by lower global growth expectations.

As luck would have it, things turned around mid-day, as we’ve seen many times before, and a slow but steady uphill climb began. In the end, the major indexes fell short of making up all losses but most of them were trimmed with the S&P 500 again reclaiming its 2,800 level.

Not helping equities were rising bond yields, which caused utilities to slide, while healthcare reversed its recent bullish move to sink for the session as well. Then German Semiconductor powerhouse Infineon AG, seemingly eroding confidence in the global economic view, slashed revenue growth outlook by a stunning 50%; not exactly awe inspiring.

Looking at the big picture, the Fed action and the recent weak data points, it should be clear that not all is well in the domestic economy, with recent wild market gyrations confirming this uncertainty. Upward momentum appears to have stalled, as the S&P 500 is engaged in a constant battle with its 2,800 level. Even though this marker has now been broken numerous times, it has rebuffed efforts to clearly climb above it and show some staying power.

It looks like the indexes are stuck and need a new driver to push prices above current levels. Otherwise, odds are pretty good that the next major move will be to the downside.

Read More

Optimism Helps Equities Rebound Despite Poor Econ Data

Ulli Market Commentary Contact

[Chart courtesy of MarketWatch.com]
  1. Moving the markets

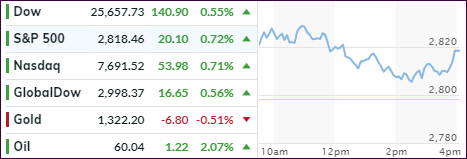
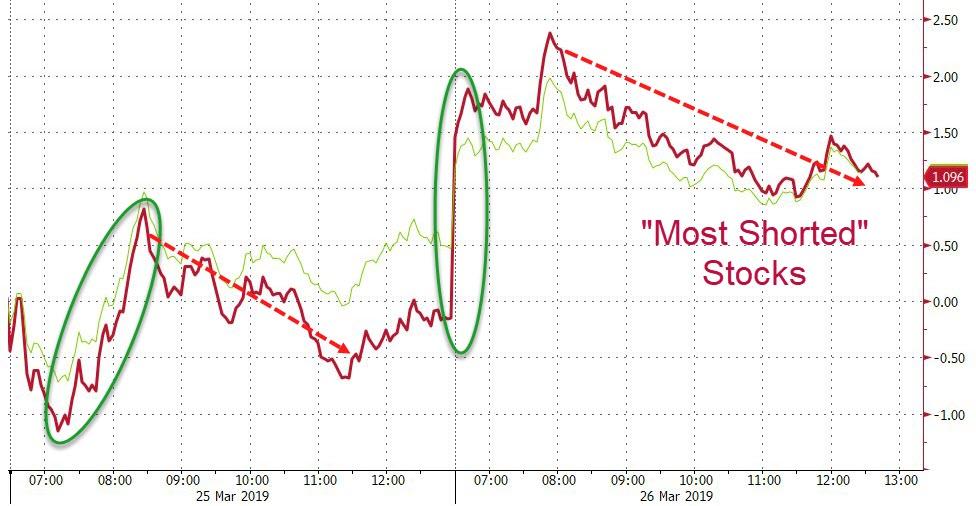
A sharp early jump in equity prices, thanks to another short squeeze, proved to be too optimistic to have staying power, so we spent the rest of the session drifting off the intraday highs. For a while it looked as if we were going to slide into the red, but thanks to sudden buying during the last 30 minutes, the major indexes reversed and closed solidly in the green.

Pulling the markets off the early highs was continued uncertainty about global growth, along with the ongoing Brexit saga. Not helping the bullish mood at all was a menu of negative data points ranging from crashing consumer confidence, slowing U.S. home price growth to poor housing starts and permits, which plunged in March.

Adding insult to injury was a ruling from a Texas district court declaring the entire ACA (Affordable Care Act) unconstitutional, a view which was shared by the U.S. Justice Department. While this so far only affected health insurance stocks, there may be more fallout in the future, should it develop into an all-out legal battle. Remember, markets hate uncertainty.

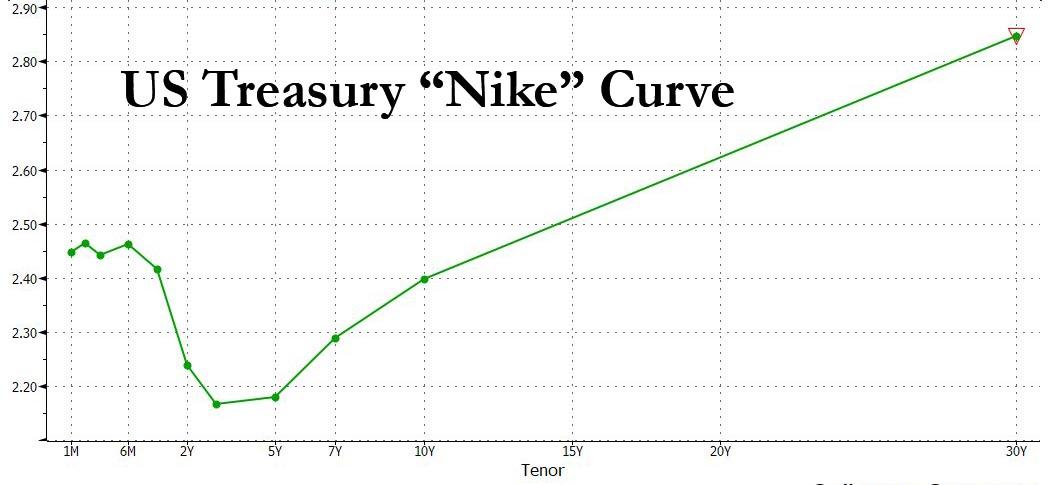
In the meantime, the yield curve inversion continued with the 3-month/10-year bonds taking the spotlight. Again, it simply means that you can invest your money in a 3-month bond and get a higher yield than in a 10-year instrument! It’s downright farcical…

Read More

Battling Growth Fears

Ulli Market Commentary Contact

[Chart courtesy of MarketWatch.com]
  1. Moving the markets

The bulls and bears engaged in another gathering of tug-of-war with the major indexes vacillating around their respective unchanged lines and, in the end, closing with no clear direction apparent.

The fallout from last Friday was obvious, as global weakness carried into today, but enough bullish momentum turned this into an uneventful session. Not helping were continued concerns about the inversion of the yield curve where short term bonds are now sporting a higher yield than longer term ones.

As a result, the focus today was more on bonds than the equity gyrations. Note that the 10-year bond yield plunged to its lowest level since 2017 but managed a modest rebound of 3 basis points to close at 2.406% after touching the 2.39% level.

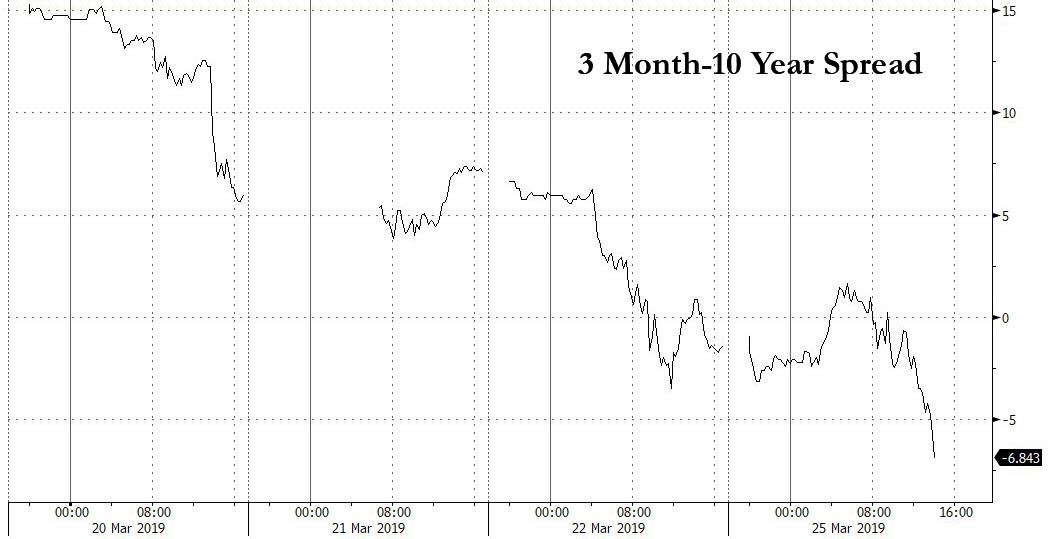
As ZH pointed out, more concerning was the ongoing slide in the 3 month-10-year bond spread, the Fed’s favorite recession indicator, which briefly plunged as much as 7 basis points before recovering to drop just 3 basis points.

If you are not familiar with it, this simply means that if you invest your money in a 3-month-bond you get more interest vs. having your funds tied up in a 10-year one. This chart demonstrates this insane oddity.

At day’s end, ZH pondered these critical questions:

Will Asia continue its selling, as the US bond market now screams global recession, and will the S&P finally breakdown as it breaches the next support level of 2,777 and if so, will it retest the December lows over 400 points lower, as so many bears have recently predicted?

 Since no one has the answer, we must be prepared to deal with this type of scenario. Our Trend Tracking Indexes (TTIs) will lead the way and give us the signal when it’s time to head for the safety of the sidelines.

Read More