
- Moving the markets
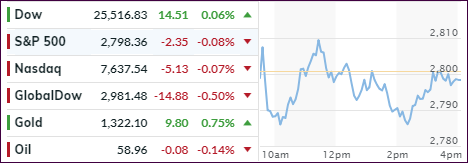
The bulls and bears engaged in another gathering of tug-of-war with the major indexes vacillating around their respective unchanged lines and, in the end, closing with no clear direction apparent.
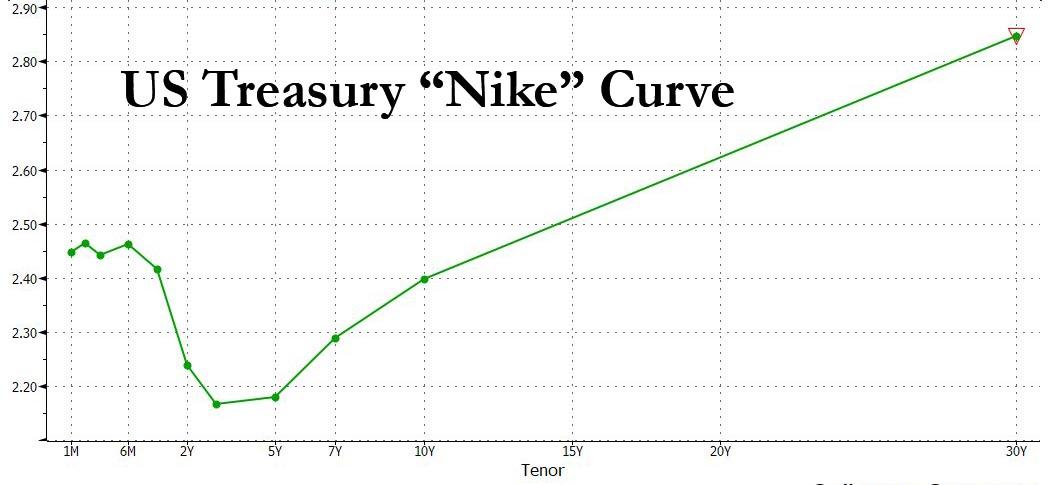
The fallout from last Friday was obvious, as global weakness carried into today, but enough bullish momentum turned this into an uneventful session. Not helping were continued concerns about the inversion of the yield curve where short term bonds are now sporting a higher yield than longer term ones.
As a result, the focus today was more on bonds than the equity gyrations. Note that the 10-year bond yield plunged to its lowest level since 2017 but managed a modest rebound of 3 basis points to close at 2.406% after touching the 2.39% level.
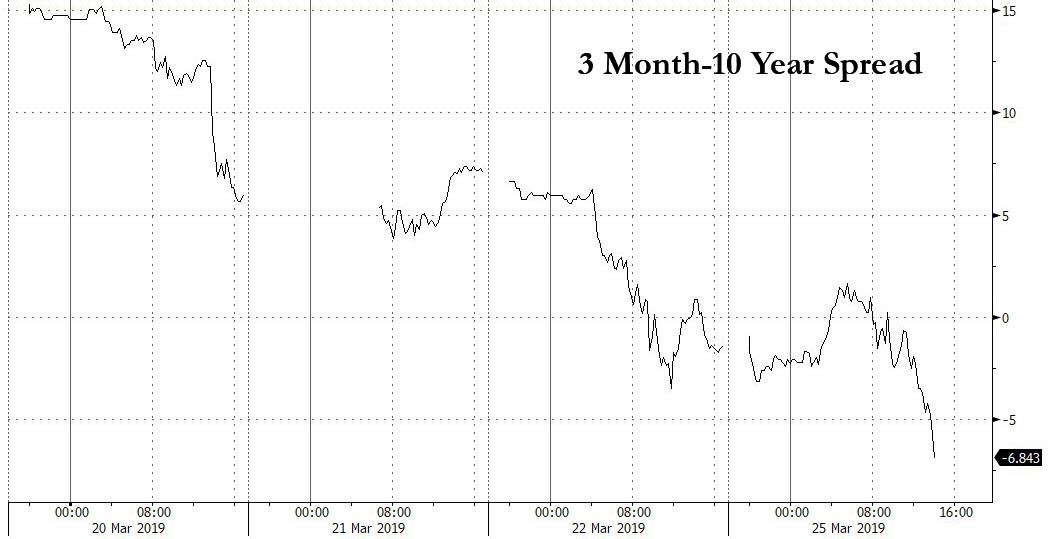
As ZH pointed out, more concerning was the ongoing slide in the 3 month-10-year bond spread, the Fed’s favorite recession indicator, which briefly plunged as much as 7 basis points before recovering to drop just 3 basis points.
If you are not familiar with it, this simply means that if you invest your money in a 3-month-bond you get more interest vs. having your funds tied up in a 10-year one. This chart demonstrates this insane oddity.
At day’s end, ZH pondered these critical questions:
Will Asia continue its selling, as the US bond market now screams global recession, and will the S&P finally breakdown as it breaches the next support level of 2,777 and if so, will it retest the December lows over 400 points lower, as so many bears have recently predicted?
Since no one has the answer, we must be prepared to deal with this type of scenario. Our Trend Tracking Indexes (TTIs) will lead the way and give us the signal when it’s time to head for the safety of the sidelines.
- ETFs in the Spotlight
In case you missed the announcement and description of this section, you can read it here again.
It features 10 broadly diversified and sector ETFs from my HighVolume list as posted every Saturday. Furthermore, they are screened for the lowest MaxDD% number meaning they have been showing better resistance to temporary sell offs than all others over the past year.
The below table simply demonstrates the magnitude with which some of the ETFs are fluctuating regarding their positions above or below their respective individual trend lines (%+/-M/A). A break below, represented by a negative number, shows weakness, while a break above, represented by a positive percentage, shows strength.
For hundreds of ETF choices, be sure to reference Thursday’s StatSheet.
For this current domestic “Buy” cycle, here’s how some our candidates have fared:
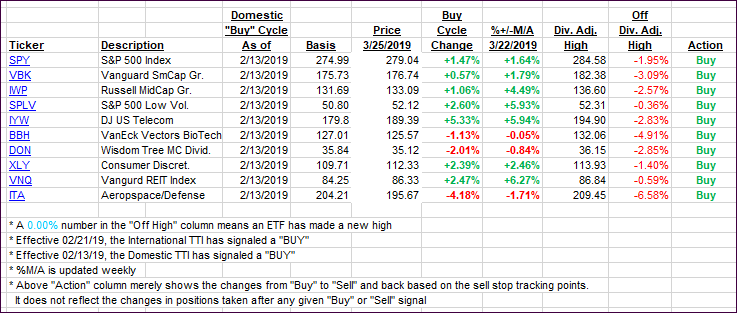
Again, the %+/-M/A column above shows the position of the various ETFs in relation to their respective long-term trend lines, while the trailing sell stops are being tracked in the “Off High” column. The “Action” column will signal a “Sell” once the -8% point has been taken out in the “Off High” column. For more volatile sector ETFs, the trigger point is -10%.
- Trend Tracking Indexes (TTIs)
Our Trend Tracking Indexes (TTIs) were mixed with the Domestic one rising slightly, while the international one dropped.
Here’s how we closed 03/25/2019:
Domestic TTI: +2.00% above its M/A (last close +1.96%)—Buy signal effective 02/13/2019
International TTI: +0.60% above its M/A (last close +1.08%)—Buy signal effective 02/21/2019
Disclosure: I am obliged to inform you that I, as well as my advisory clients, own some of the ETFs listed in the above table. Furthermore, they do not represent a specific investment recommendation for you, they merely show which ETFs from the universe I track are falling within the specified guidelines.
Contact Ulli