
- Moving the markets
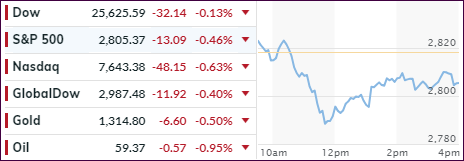
While the major indexes opened in the green, the time spent above their respective unchanged lines was cut short, as sellers took charge and drove equities straight south supported by lower global growth expectations.
As luck would have it, things turned around mid-day, as we’ve seen many times before, and a slow but steady uphill climb began. In the end, the major indexes fell short of making up all losses but most of them were trimmed with the S&P 500 again reclaiming its 2,800 level.
Not helping equities were rising bond yields, which caused utilities to slide, while healthcare reversed its recent bullish move to sink for the session as well. Then German Semiconductor powerhouse Infineon AG, seemingly eroding confidence in the global economic view, slashed revenue growth outlook by a stunning 50%; not exactly awe inspiring.
Looking at the big picture, the Fed action and the recent weak data points, it should be clear that not all is well in the domestic economy, with recent wild market gyrations confirming this uncertainty. Upward momentum appears to have stalled, as the S&P 500 is engaged in a constant battle with its 2,800 level. Even though this marker has now been broken numerous times, it has rebuffed efforts to clearly climb above it and show some staying power.
It looks like the indexes are stuck and need a new driver to push prices above current levels. Otherwise, odds are pretty good that the next major move will be to the downside.
- ETFs in the Spotlight
In case you missed the announcement and description of this section, you can read it here again.
It features 10 broadly diversified and sector ETFs from my HighVolume list as posted every Saturday. Furthermore, they are screened for the lowest MaxDD% number meaning they have been showing better resistance to temporary sell offs than all others over the past year.
The below table simply demonstrates the magnitude with which some of the ETFs are fluctuating regarding their positions above or below their respective individual trend lines (%+/-M/A). A break below, represented by a negative number, shows weakness, while a break above, represented by a positive percentage, shows strength.
For hundreds of ETF choices, be sure to reference Thursday’s StatSheet.
For this current domestic “Buy” cycle, here’s how some our candidates have fared:
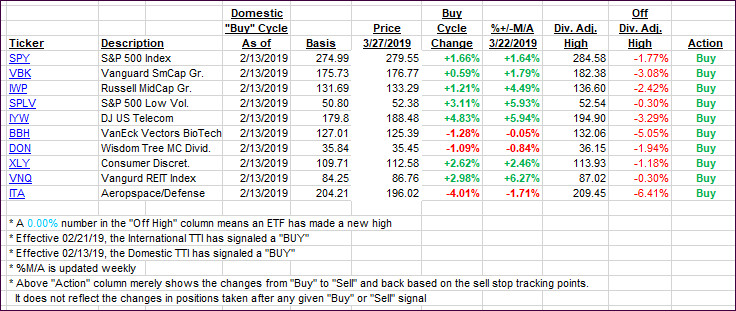
Again, the %+/-M/A column above shows the position of the various ETFs in relation to their respective long-term trend lines, while the trailing sell stops are being tracked in the “Off High” column. The “Action” column will signal a “Sell” once the -8% point has been taken out in the “Off High” column. For more volatile sector ETFs, the trigger point is -10%.
- Trend Tracking Indexes (TTIs)
Our Trend Tracking Indexes (TTIs) pulled back as the bears were in charge of this session.
Here’s how we closed 03/27/2019:
Domestic TTI: +2.51% above its M/A (last close +2.85%)—Buy signal effective 02/13/2019
International TTI: +0.79% above its M/A (last close +1.15%)—Buy signal effective 02/21/2019
Disclosure: I am obliged to inform you that I, as well as my advisory clients, own some of the ETFs listed in the above table. Furthermore, they do not represent a specific investment recommendation for you, they merely show which ETFs from the universe I track are falling within the specified guidelines.
Contact Ulli