Equities Tank As The Trade Drama Continues

Ulli Market Commentary, Uncategorized Contact

[Chart courtesy of MarketWatch.com]

  1. Moving the markets

Volatility returned with a vengeance, as uncertainty about the U.S.-China trade talks ratcheted up a notch, despite Vice Premier Liu He’s intention to attend trade talks this week in Washington.

However, that did nothing to soothe nervous traders on Wall Street, who concluded that no resolution would materialize by Friday, the day on which the import duties for Chinese goods would be hiked substantially. To save the markets from further destruction, it would not surprise me if the tariff deadline will be postponed, say on Thursday prior to the close.

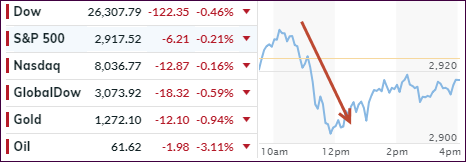
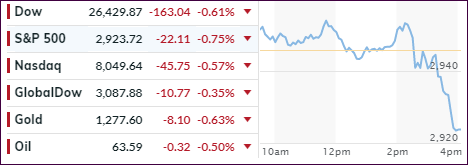
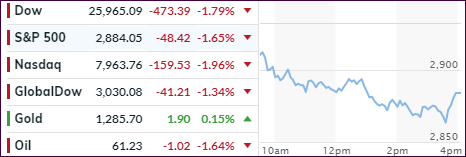
The bears took over, and the selling accelerated throughout the session with the Dow being down around 600 points at one time. Luckily, buyers appeared during the last 30 minutes and erased some the of the losses. However, the major indexes tumbled in unison, with the S&P 500 improving the most during the late session rebound.

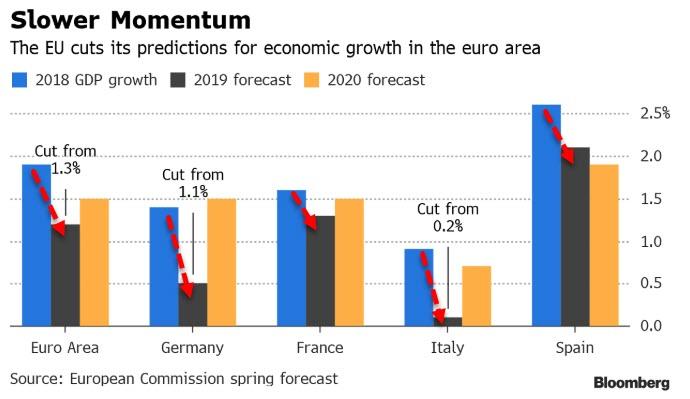
Contributing to the sour sentiment was the EU, which slashed their growth outlook for the region, as this chart shows. Maybe we are finally seeing some reality creeping into the prior hope-filled economic forecasts. After all, you can only put so much lipstick on a pig…

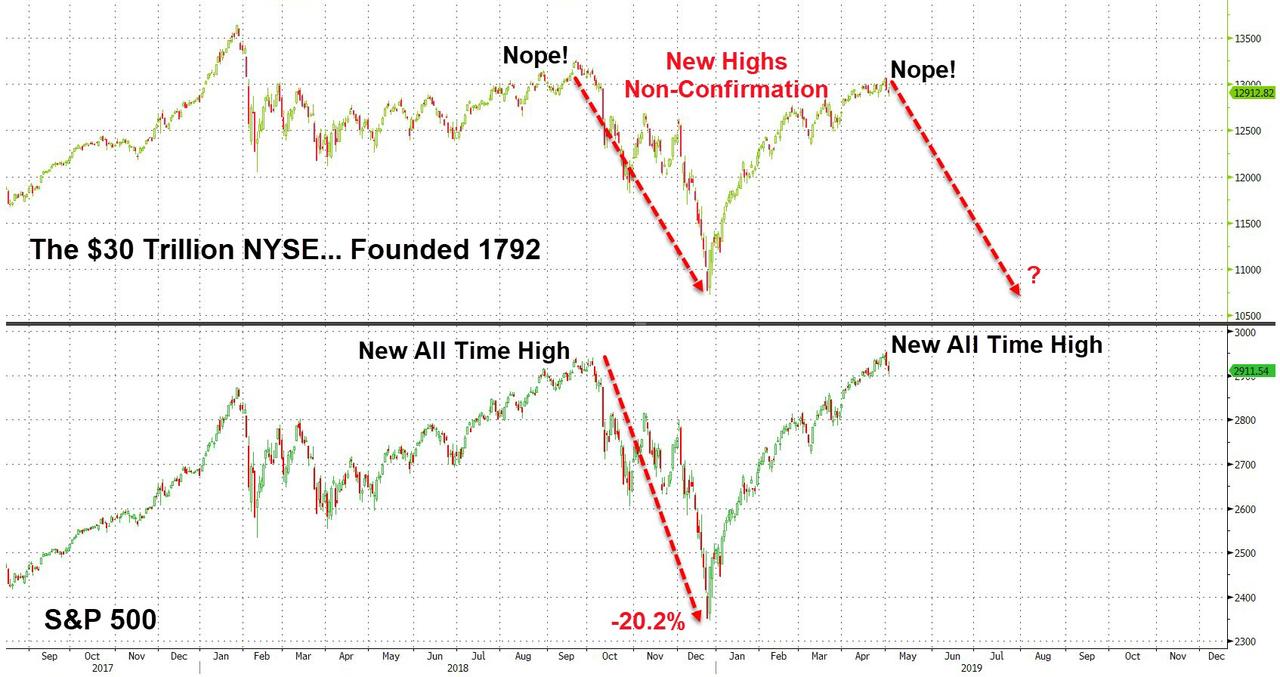
Again, it pays to look at this graph portraying the NYSE index, the world’s largest, which is flashing a divergence to the S&P 500. It shows that for the second time the S&P 500 has made a new all-time high, and the NYSE index did follow suit. You can see what subsequently happened last summer when the S&P took a 20% dive.

Right now, it looks to be an almost identical set up, which presents the question “will it be different this time?” Since no one has that answer, we will have to wait and see how things will play out.

Despite today’s equity dump, our Trend Tracking strategy was not affected, nor did any sell stops get triggered. 

Read More
Dropping And Popping; Another Miraculous Rebound

Ulli Market Commentary, Uncategorized Contact

[Chart courtesy of MarketWatch.com]

  1. Moving the markets

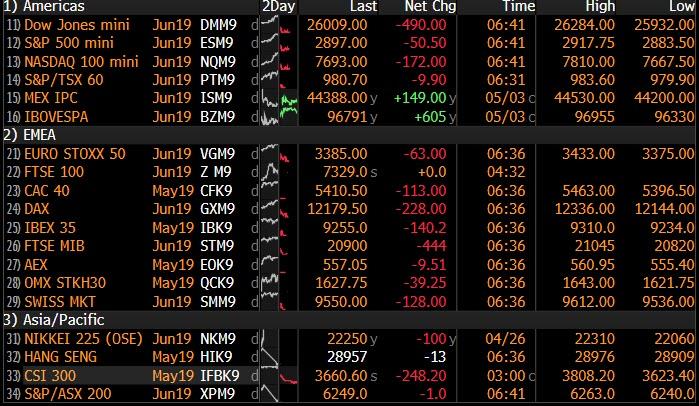
The futures market was hit hard last night with the Dow being down some 500 points, while the S&P 500 got hammered at the tune of -2.4%. By the time, the regular session opened, some of these losses had already been made up, and we started the day with the Dow in the red by ‘only’ 300 points.

Global stocks crashed as well, all in reaction Trump’s announcement that the U.S.-China trade deal was not only not going “optimistically” but had effectively collapsed, and tariffs on $200 billion of Chinese imports would be hiked to 25%.

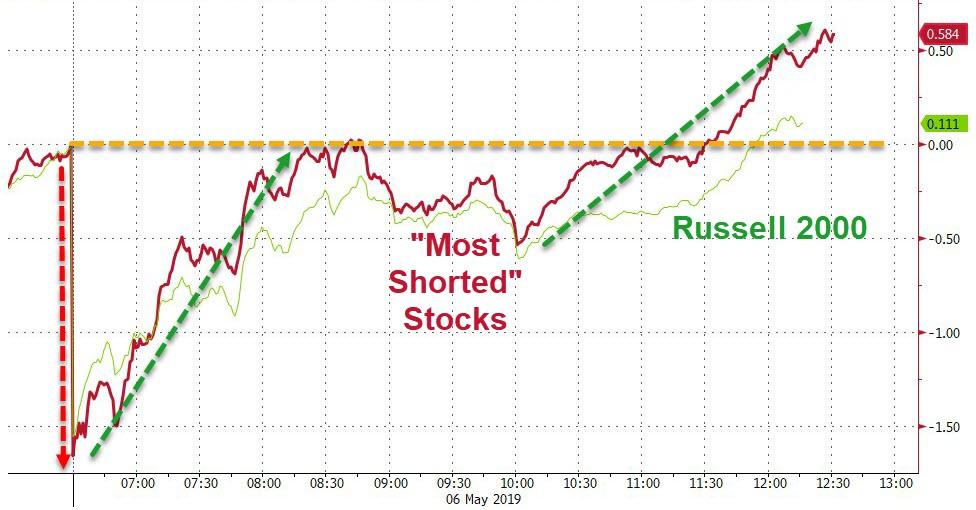
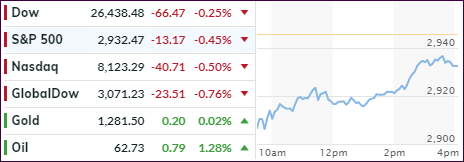
The result was a sea of red in just about all markets overnight, but things calmed down as today’s session got underway with a magical comeback in the making, severely cutting down the losses which, at the end, were barely noteworthy.

Helping the recovery was a giant short squeeze and most likely strong buying power generated via the Plunge Protection Team (PPT). Helping to ramp the markets higher was sudden news that China would send a smaller delegation to Washington rather than the 100-person group originally scheduled. Of course, whether this group will talk or simply sightsee remains to be seen.

While this movie may not be over, for right now at least, no damage has been done regarding major trend direction.

Read More

No Market Commentary

Ulli Uncategorized Contact

As I posted yesterday, I will not be able to write today’s commentary nor tomorrow’s “ETFs on the Cutline” report.

Regular posting will resume on Monday.

Ulli…

Weekly StatSheet For The ETF Tracker Newsletter – Updated Through 05/02/2019

Ulli ETF StatSheet Contact

ETF Data updated through Thursday, May 2, 2019

Methodology/Use of this StatSheet:

  1. From the universe of over 1,800 ETFs, I have selected only those with a trading volume of over $5 million per day (HV ETFs), so that liquidity and a small bid/ask spread are assured.
  2. Trend Tracking Indexes (TTIs)

Buy or Sell decisions for Domestic and International ETFs (section 1 and 2), are made based on the respective TTI and its position either above or below its long-term M/A (Moving Average). A crossing of the trend line from below accompanied by some staying power above constitutes a “Buy” signal. Conversely, a clear break below the line constitutes a “Sell” signal. Additionally, I use a 7.5% trailing stop loss on all positions in these categories to control downside risk.

  1. All other investment arenas do not have a TTI and should be traded based on the position of the individual ETF relative to its own respective trend line (%M/A). That’s why those signals are referred to as a “Selective Buy.” In other words, if an ETF crosses its own trendline to the upside, a “Buy” signal is generated. Since these areas tend to be more volatile, I recommend a wider trailing sell stop of 7.5% -10% depending on your risk tolerance.

If you are unfamiliar with some of the terminology, please see Glossary of Terms and new subscriber information in section 9.


  1. DOMESTIC EQUITY ETFs: BUY — since 02/13/2019

Click on chart to enlarge

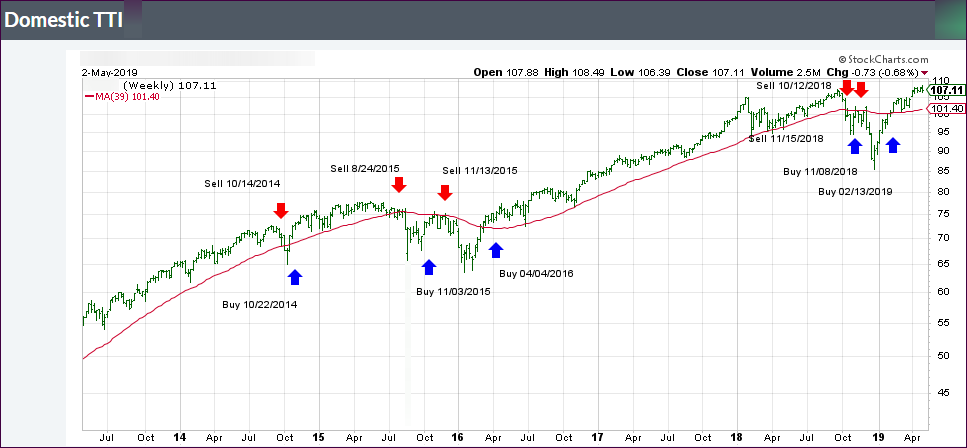
Our main directional indicator, the Domestic Trend Tracking Index (TTI-green line in the above chart) is now positioned above its long-term trend line (red) by +5.73% after having generated a new Domestic “Buy” signal effective 2/13/19 as posted.

Read More

Markets In Retreat Mode

Ulli Market Commentary Contact

[Chart courtesy of MarketWatch.com]
  1. Moving the markets

After an early meandering around their respective unchanged lines, the major indexes took a sudden steep dive and quickly red numbers spread across traders’ computer screens.

The scramble to find the culprit was on. Turns out that news by the India press that US-China trade negotiations had hit a brick wall, and thereby an impasse, caused the already nervous Wall Streeters, which were still reeling from the Fed’s “transitory hawkishness,” to push the sell buttons. The Dow dropped some 220 points before finding a bottom.

ZeroHedge, as always tongue-in-cheek, was quick to tweet a suggestion to the White House to resolve this sudden and unexpected market drop:

White House to do list:

1) Unleash the Kudlow

2) call the PPT

3) demand QE

Despite no White House response, the major indexes managed to climb back and cut the early losses in half with the Dow now heading towards its second down week in a row since December 21st.

When well-known indexes, such as the S&P 500, make a new all-time high, and there is no confirmation from another well-known index covering the same markets, such as the NYSE, you must wonder if history will repeat itself regarding the subsequent -20% sell-off. ZH posted this chart, leaving open the question as to whether the lack of the NYSE making its new all-time high again could be a bad omen for the S&P 500.

On a personal note, I am out tomorrow and will not be able to write the market commentary nor Saturday’s ‘ETFs on the Cutline’ report. My wife and I will be traveling out of town celebrating my son’s college graduation.

Regular posting will resume on Monday.

Read More

Fed Does Not Cave To White House Demands — Holds Rates Steady, Disappoints Markets

Ulli Market Commentary Contact

[Chart courtesy of MarketWatch.com]
  1. Moving the markets

The session started with the major indexes edging higher, that is until the Fed came out stating that current “policy is appropriate with no bias to hike or cut.” Powell further elaborated that U.S. inflation is “possibly being dragged down by ‘transitory’ forces” and that their current stance is “appropriate right now” and “we don’t see a strong case for moving in either direction.”

That put an end to the rumor that the White House is dictating Fed policy and most likely also served as a face-saving action by the Fed, which it had been in dire need of, ever since the sudden policy U-turn last December.

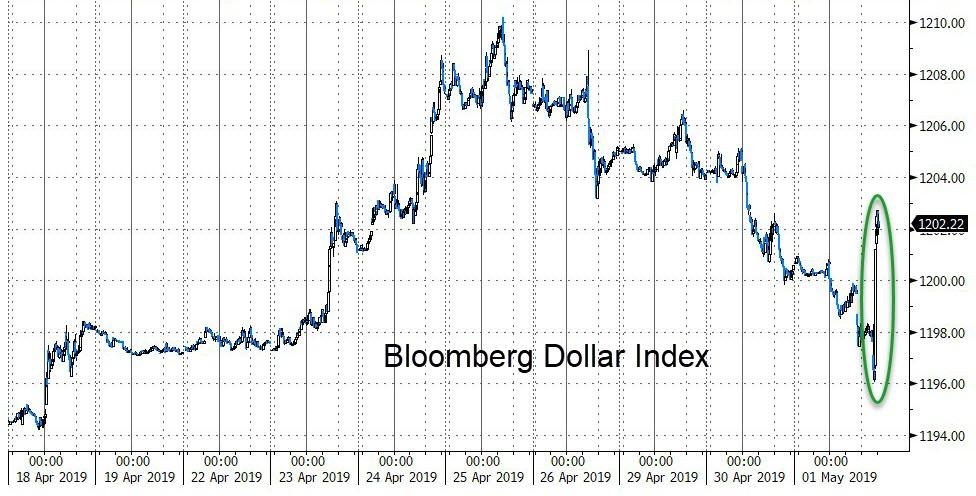
The markets were hoping for a more “dovish” stance from the Fed, so traders decided to hit the sell buttons during the last hour to share their disappointment with the investing public. Apparently, the Fed’s use of the word “transitory” did not only have a negative effect on stocks but also bonds and gold, while the US dollar benefited and spiked.

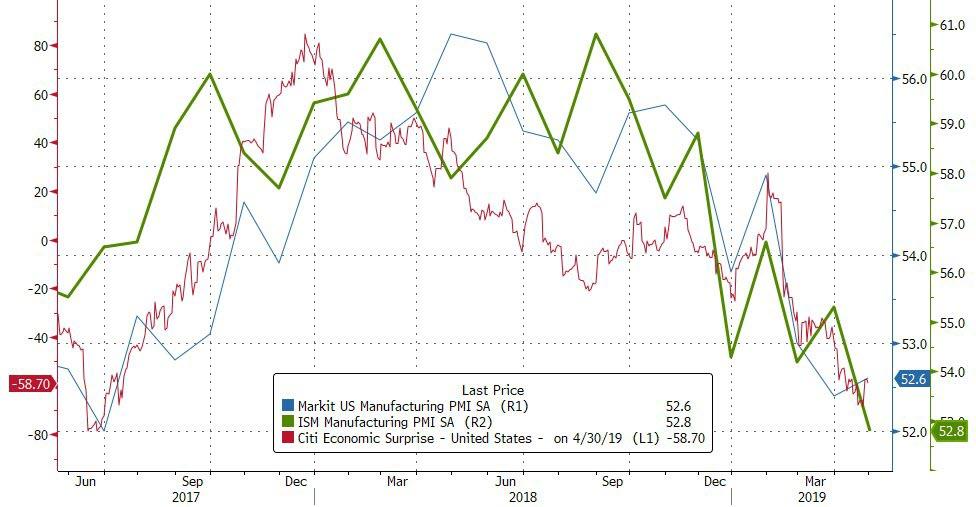
Economic news continued to present more negatives. The manufacturing index plunged to October 2016 lows, while the gauge for export orders dropped below 50 for the first time in three years, as imports missed the threshold for the first time in two years, according to ZH.

This ended up being a poor start to the month of May, and we’ll have to wait and see if the adage “sell in May and go away,” proves to be correct again.

Read More