
- Moving the markets
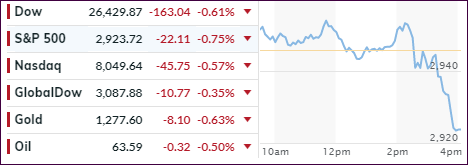
The session started with the major indexes edging higher, that is until the Fed came out stating that current “policy is appropriate with no bias to hike or cut.” Powell further elaborated that U.S. inflation is “possibly being dragged down by ‘transitory’ forces” and that their current stance is “appropriate right now” and “we don’t see a strong case for moving in either direction.”
That put an end to the rumor that the White House is dictating Fed policy and most likely also served as a face-saving action by the Fed, which it had been in dire need of, ever since the sudden policy U-turn last December.
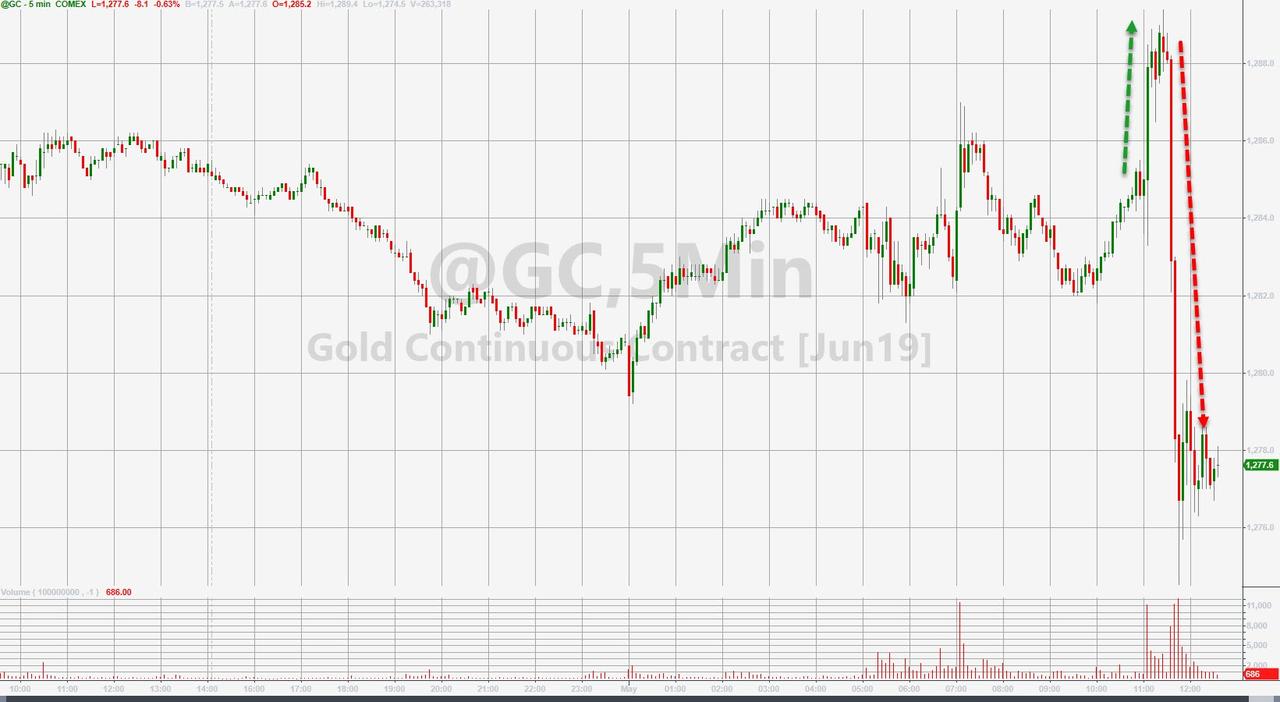
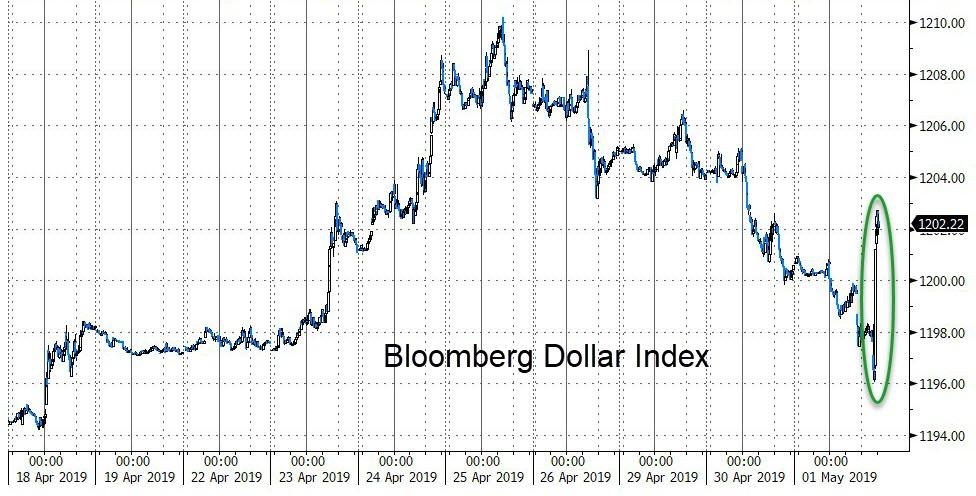
The markets were hoping for a more “dovish” stance from the Fed, so traders decided to hit the sell buttons during the last hour to share their disappointment with the investing public. Apparently, the Fed’s use of the word “transitory” did not only have a negative effect on stocks but also bonds and gold, while the US dollar benefited and spiked.
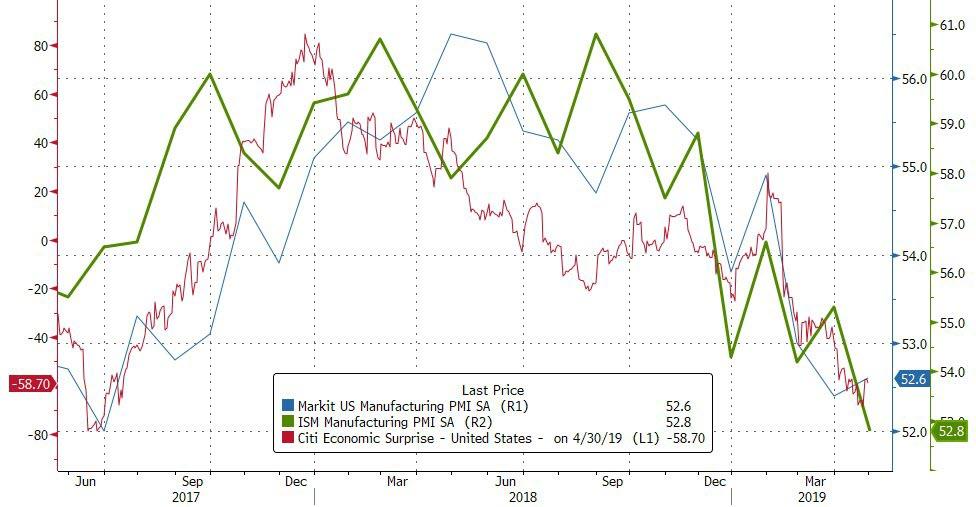
Economic news continued to present more negatives. The manufacturing index plunged to October 2016 lows, while the gauge for export orders dropped below 50 for the first time in three years, as imports missed the threshold for the first time in two years, according to ZH.
This ended up being a poor start to the month of May, and we’ll have to wait and see if the adage “sell in May and go away,” proves to be correct again.
- ETFs in the Spotlight
In case you missed the announcement and description of this section, you can read it here again.
It features 10 broadly diversified and sector ETFs from my HighVolume list as posted every Saturday. Furthermore, they are screened for the lowest MaxDD% number meaning they have been showing better resistance to temporary sell offs than all others over the past year.
The below table simply demonstrates the magnitude with which some of the ETFs are fluctuating regarding their positions above or below their respective individual trend lines (%+/-M/A). A break below, represented by a negative number, shows weakness, while a break above, represented by a positive percentage, shows strength.
For hundreds of ETF choices, be sure to reference Thursday’s StatSheet.
For this current domestic “Buy” cycle, here’s how some our candidates have fared:
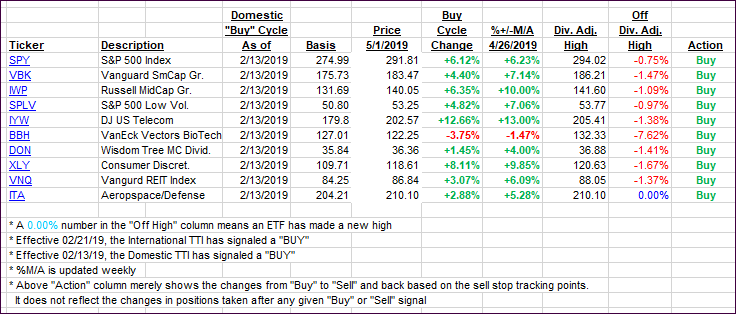
Again, the %+/-M/A column above shows the position of the various ETFs in relation to their respective long-term trend lines, while the trailing sell stops are being tracked in the “Off High” column. The “Action” column will signal a “Sell” once the -8% point has been taken out in the “Off High” column. For more volatile sector ETFs, the trigger point is -10%.
- Trend Tracking Indexes (TTIs)
Our Trend Tracking Indexes (TTIs) came off their highs as the markets sold off during the last hour.
Here’s how we closed 05/01/2019:
Domestic TTI: +5.72% above its M/A (last close +6.79%)—Buy signal effective 02/13/2019
International TTI: +4.00% above its M/A (last close +4.41%)—Buy signal effective 02/21/2019
Disclosure: I am obliged to inform you that I, as well as my advisory clients, own some of the ETFs listed in the above table. Furthermore, they do not represent a specific investment recommendation for you, they merely show which ETFs from the universe I track are falling within the specified guidelines.
Contact Ulli