
- Moving the markets
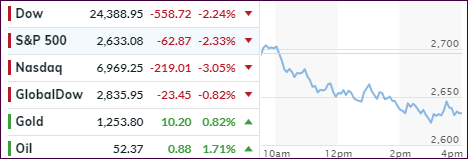
An early ramp ran into resistance around mid-day when sentiment turned bearish, and sellers pulled the major indexes not just off their high points but also to a close at the lows of the day. Good thing the clock ran out, or we might have seen another reversal with nothing to show for.
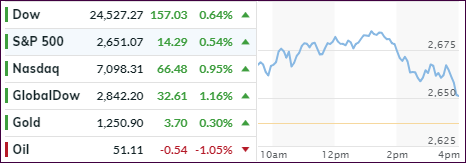
As it turned out, the major indexes managed to score some modest gains with early support coming from the main recent driver of market direction, namely boosted expectations that a US/China trade deal might materialize in the coming months. Translated, that means to me that we’ll be riding this roller-coaster a while longer until something definite and verifiable can be reached between the jawboning parties.
Other positives out of China were news that they might allow foreign corporations greater access to their markets, and that they will lower tariffs on US autos and increase soybean purchases. While these are steps in the right direction, they were simply not enough to keep early upward market momentum going, as headlines about Cohen and National Enquirer disclosure offset the exuberant mood.
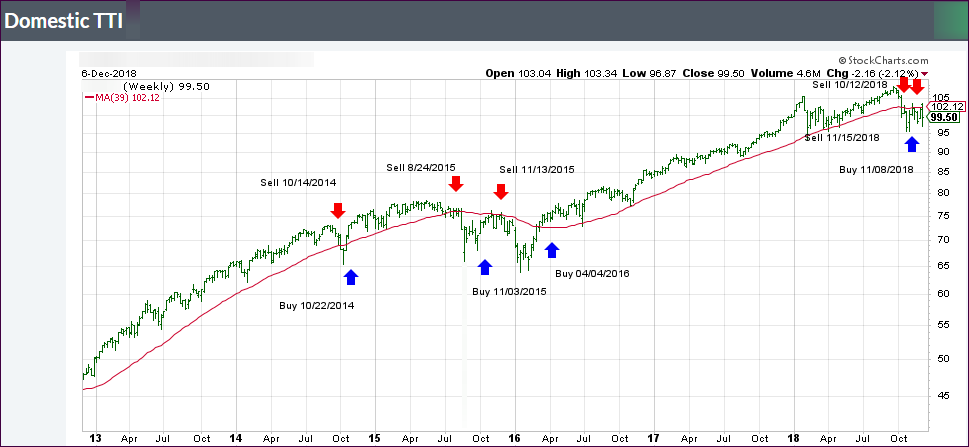
In the end, the modest gains certainly were not enough to conquer any bearish tendencies, as our Trend Tracking Indexes (TTIs) improved slightly but remain firmly entrenched below their respective long-term trend lines.