
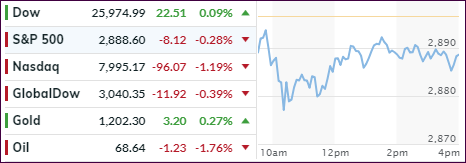
- Moving the markets
The major indexes started the session in the red caused by a sharp decline in the tech sector (over 1%), which was its worst day since July. The downside assist came from social media executives (FB, TWTR), who testified on Capitol Hill about misinformation and the battle for truth in reporting.
Not helping were the continued trade discussions with Canada, as both parties dug in and appeared hardnosed about their views of what terms are acceptable and which ones are not. The Canadian’s reiterated their stance that “no Nafta is better than a bad Nafta deal for Canadians, and that’s what we are going to stay with.” So, that appears to be a dead-end street for the time being and another negative for the markets by undermining confidence in equities.
On the other hand, tech has been on a hot streak for most of this year, so a pullback based on profit taking, since some of the big banks and brokerage houses have suggested their clients to “lighten up on tech exposure,” may have contributed to the decline.
Looking at the big picture, global stocks in general (Asia and Europe) are having a down day, as contagion concerns from the Emerging Markets (EMs) appear to spill over into the developed markets. With the Fed being on course to continue with its rate hike program, which will affect EMs negatively, the turmoil is likely to worsen in the future. For reference, we sold our holdings in EMs back in February and currently have no exposure at all.
- ETFs in the Spotlight
In case you missed the announcement and description of this section, you can read it here again.
It features 10 broadly diversified and sector ETFs from my HighVolume list as posted every Saturday. Furthermore, they are screened for the lowest MaxDD% number meaning they have been showing better resistance to temporary sell offs than all others over the past year.
The below table simply demonstrates the magnitude with which some of the ETFs are fluctuating regarding their positions above or below their respective individual trend lines (%M/A). A break below, represented by a negative number, shows weakness, while a break above, represented by a positive percentage, shows strength.
For hundreds of ETF choices, be sure to reference Thursday’s StatSheet.
Year to date, here’s how our candidates have fared so far:
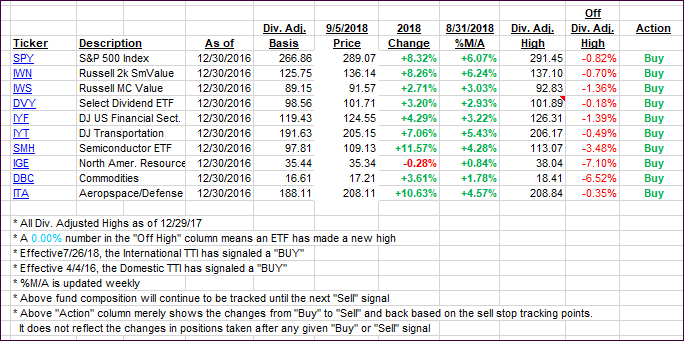
Again, the %M/A column above shows the position of the various ETFs in relation to their respective long-term trend lines, while the trailing sell stops are being tracked in the “Off High” column. The “Action” column will signal a “Sell” once the -8% point has been taken out in the “Off High” column. For more volatile sector ETFs, the trigger point is -10%.
- Trend Tracking Indexes (TTIs)
Our Trend Tracking Indexes (TTIs) were mixed with the Domestic one gaining a fraction while the International one headed south. Here again, I will wait for further confirmation before declaring this International ‘Buy’ cycle to be over.
Here’s how we closed 09/05/2018:
Domestic TTI: +5.02% above its M/A (last close +4.97%)—Buy signal effective 4/4/2016
International TTI: -1.31% below its M/A (last close -0.89%)—Buy signal effective 7/26/2018
Disclosure: I am obliged to inform you that I, as well as my advisory clients, own some of the ETFs listed in the above table. Furthermore, they do not represent a specific investment recommendation for you, they merely show which ETFs from the universe I track are falling within the guidelines specified.
Contact Ulli