
- Moving the markets
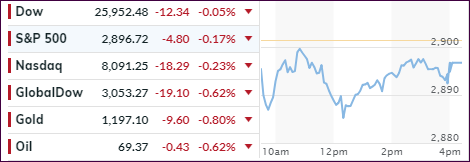
Despite several attempts, the major indexes could not gather enough bullish momentum to break above the unchanged line and stay there. Instead, it was a see-saw session that saw the indexes ending up with minor losses.
Trade tensions with Canada contributed to the uncertainties in the market as Trump threatened to “leave Canada out of any new NAFTA pact.” The talks were halted with no tangible agreement, but at least the parties agreed to meet again. Regarding China, the tariffs of an additional $200 billion will begin on Thursday.
We may see some more sideways action until Friday when the employment report will be released. As one portfolio manager opined: “It should set the tone for the remainder of the month, from the Fed meeting to views on inflationary pressures and overall growth. The betting is more of the same, good numbers, good equity markets, and still growing economy.”
Just because most MSM does not report it does not mean the Emerging Market crisis has been resolved. Far from it. While Turkey has been relatively quiet, today it was the South African Rand and the Argentine Peso, both of which were in freefall this morning causing their bond yields to jump and their stock markets to drop. This is a developing story, and I firmly believe that this contagion will go global.
Right now, however, the contagion is just starting and has not yet affected the western industrialized nations keeping us invested in the markets, until there is a clear change in long-term direction.
- ETFs in the Spotlight
In case you missed the announcement and description of this section, you can read it here again.
It features 10 broadly diversified and sector ETFs from my HighVolume list as posted every Saturday. Furthermore, they are screened for the lowest MaxDD% number meaning they have been showing better resistance to temporary sell offs than all others over the past year.
The below table simply demonstrates the magnitude with which some of the ETFs are fluctuating regarding their positions above or below their respective individual trend lines (%M/A). A break below, represented by a negative number, shows weakness, while a break above, represented by a positive percentage, shows strength.
For hundreds of ETF choices, be sure to reference Thursday’s StatSheet.
Year to date, here’s how our candidates have fared so far:
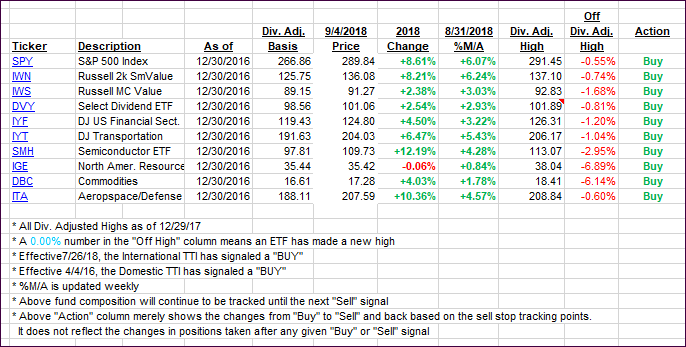
Again, the %M/A column above shows the position of the various ETFs in relation to their respective long-term trend lines, while the trailing sell stops are being tracked in the “Off High” column. The “Action” column will signal a “Sell” once the -8% point has been taken out in the “Off High” column. For more volatile sector ETFs, the trigger point is -10%.
- Trend Tracking Indexes (TTIs)
Our Trend Tracking Indexes (TTIs) both slipped as market uncertainty reigned.
Here’s how we closed 09/04/2018:
Domestic TTI: +4.97% above its M/A (last close +5.07%)—Buy signal effective 4/4/2016
International TTI: -0.89% below its M/A (last close -0.17%)—Buy signal effective 7/26/2018
Disclosure: I am obliged to inform you that I, as well as my advisory clients, own some of the ETFs listed in the above table. Furthermore, they do not represent a specific investment recommendation for you, they merely show which ETFs from the universe I track are falling within the guidelines specified.
Contact Ulli