Weekly StatSheet For The ETF Tracker Newsletter – Updated Through 06/06/2019

Ulli ETF StatSheet Contact

ETF Data updated through Thursday, June 6, 2019
Methodology/Use of this StatSheet:

1. From the universe of over 1,800 ETFs, I have selected only those with a trading volume of over $5 million per day (HV ETFs), so that liquidity and a small bid/ask spread are assured.

2. Trend Tracking Indexes (TTIs)

Buy or Sell decisions for Domestic and International ETFs (section 1 and 2), are made based on the respective TTI and its position either above or below its long-term M/A (Moving Average). A crossing of the trend line from below accompanied by some staying power above constitutes a “Buy” signal. Conversely, a clear break below the line constitutes a “Sell” signal. Additionally, I use a 7.5% trailing stop loss on all positions in these categories to control downside risk.

3. All other investment arenas do not have a TTI and should be traded based on  the position of the individual ETF relative to its own respective trend line (%M/A). That’s why those signals are referred to as a “Selective Buy.” In other words, if an ETF crosses its own trendline to the upside, a “Buy” signal is generated. Since these areas tend to be more volatile, I recommend a wider trailing sell stop of 7.5% -10% depending on your risk tolerance.

If you are unfamiliar with some of the terminology, please see Glossary of Terms and new subscriber information in section 9.     

1. DOMESTIC EQUITY ETFs: BUY — since 02/13/2019
Click on chart to enlarge

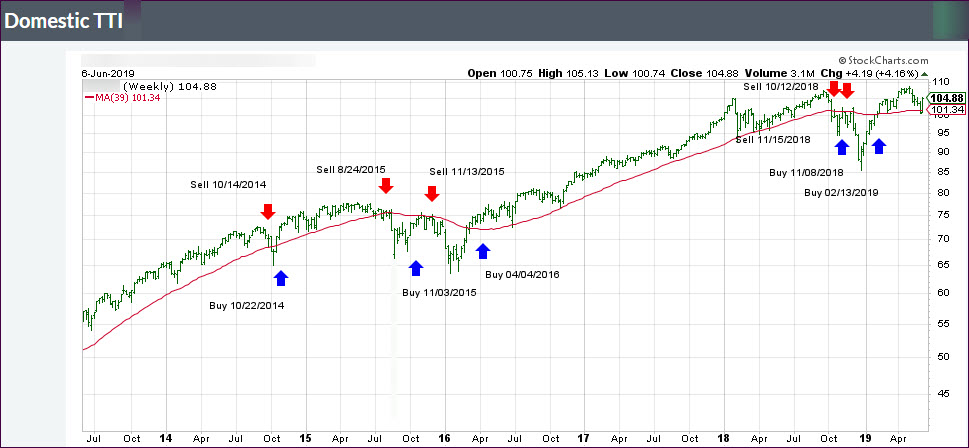
Our main directional indicator, the Domestic Trend Tracking Index (TTI-green line in the above chart) is now positioned above its long-term trend line (red) by +3.49% after having generated a new Domestic “Buy” signal effective 2/13/19 as posted.

Read More
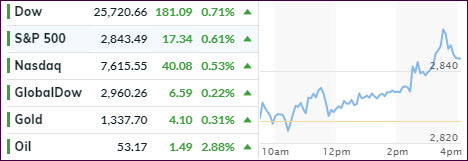
Keeping The Bullish Dream Alive

Ulli Market Commentary Contact

[Chart courtesy of MarketWatch.com]

  1. Moving the markets

Despite an early struggle for direction, bullish momentum picked up with the major indexes notching another day of gains making this the third winning session in a row.

The trade battles with China and Mexico continued unabated but mixed news was put simply on the back burner. Traders decided to put their focus instead on something more hopeful, namely that the Fed could deliver an interest rate cut and not follow the ECB, which postponed any monetary changes till next year.

It was this type of wishful thinking that supported upside market momentum and kept the bears in check, despite the threat of Mexican tariff going into effect next Monday. Trump said that despite ongoing negotiations “not nearly enough” progress has been made.

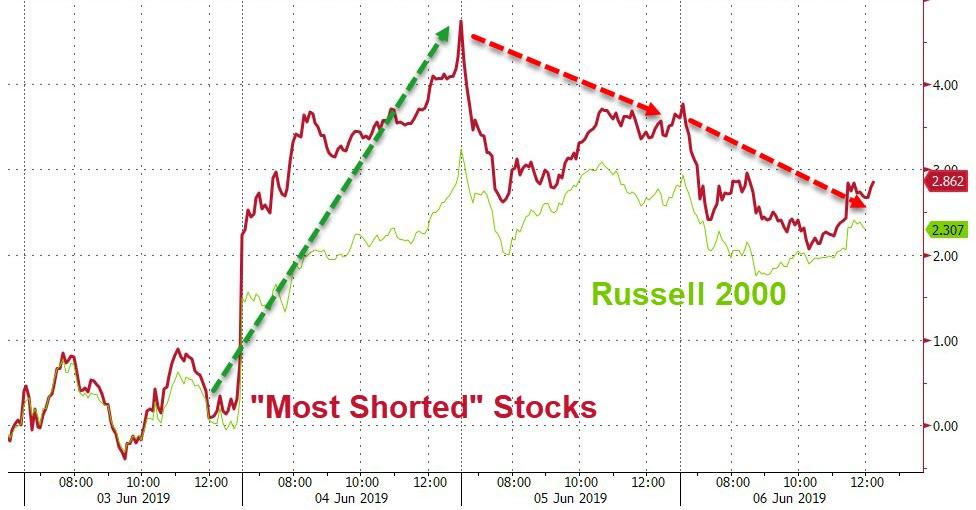
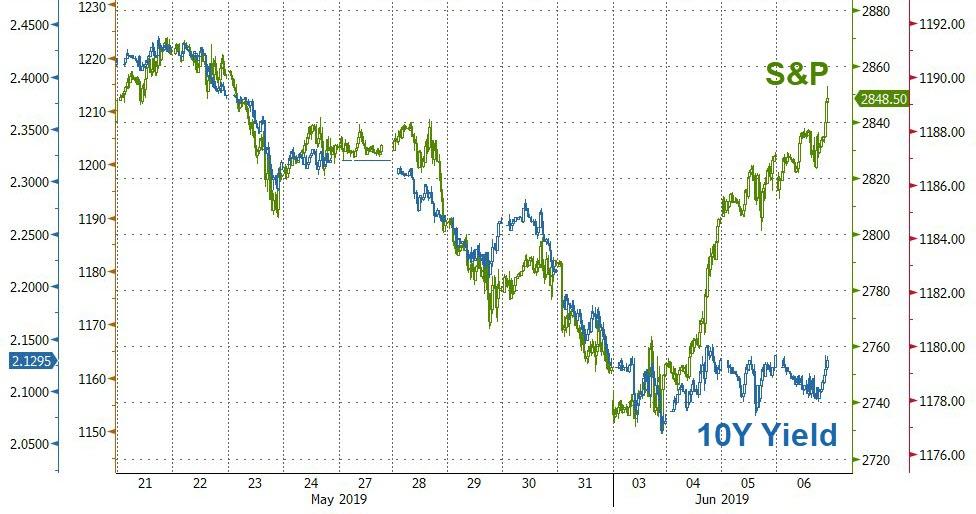
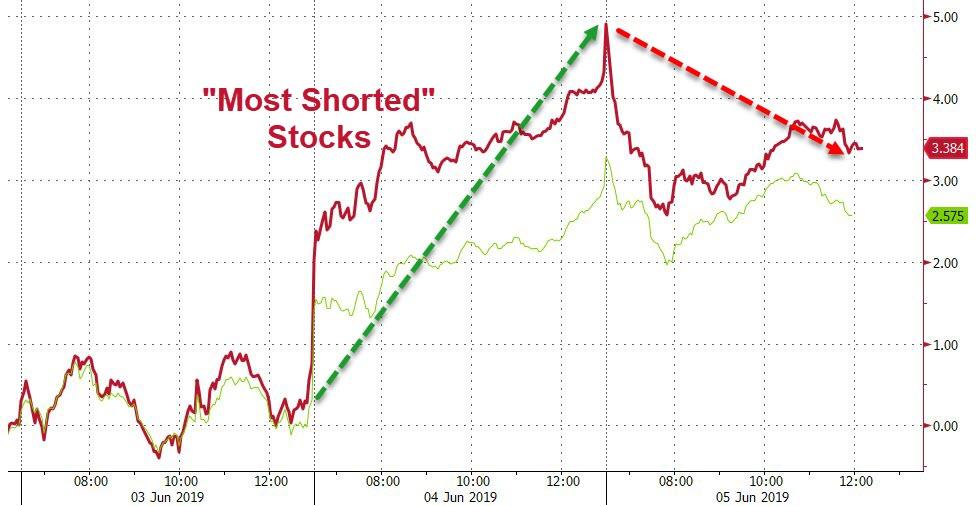
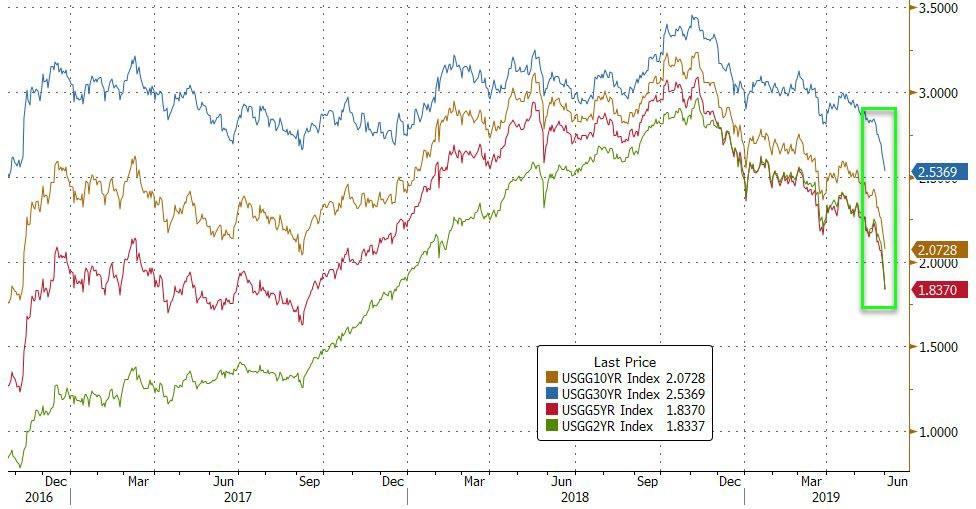
The most shorted stocks were left alone by traders for the second day in a row thereby not contributing to this winning session. Bond yields were steady with the 10-year barely nudging but, in the bigger picture, the decoupling of its yield vs. the S&P 500 remains extreme, as this graph shows.

Our International TTI managed to conquer its long-term trend line, but only by a tiny margin (see section 3), which was not significant enough to consider this a reversal of the recent downtrend—yet.  

Read More

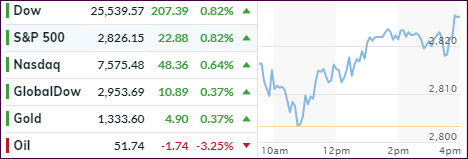
Ramping Higher In The Face Of Plunging Oil Prices

Ulli Market Commentary Contact

[Chart courtesy of MarketWatch.com]

  1. Moving the markets

Equities started the session in the positive, before a mid-day pullback interrupted follow through buying from yesterday. The pause was short-lived and, despite conflicting economic data, the bulls charged ahead with the major indexes closing around their session highs, despite yesterday’s short squeeze running out of ammo.

ADP payroll data painted a bleak picture with only 27k job additions for May vs. an expexted 185k, which was the weakest growth since early 2010. That was another feather in Fed’s cap, since it may find even more justification for another cut in interest rates.

This was the reasoning behind today’s rally, which was boosted by hopes that the global economy is deteriorating fast enough to validate a cut, perhaps as soon as this month, to avoid a possible recession. At least that’s how the theory goes.

Some strategists are pointing towards the disconnect between the economy and stocks, which has reached a record high, making the case for a potential return to bear market territory, along with a revisit of the December lows, a real likelihood.

Economist David Rosenberg summed things up in this concise tweet:

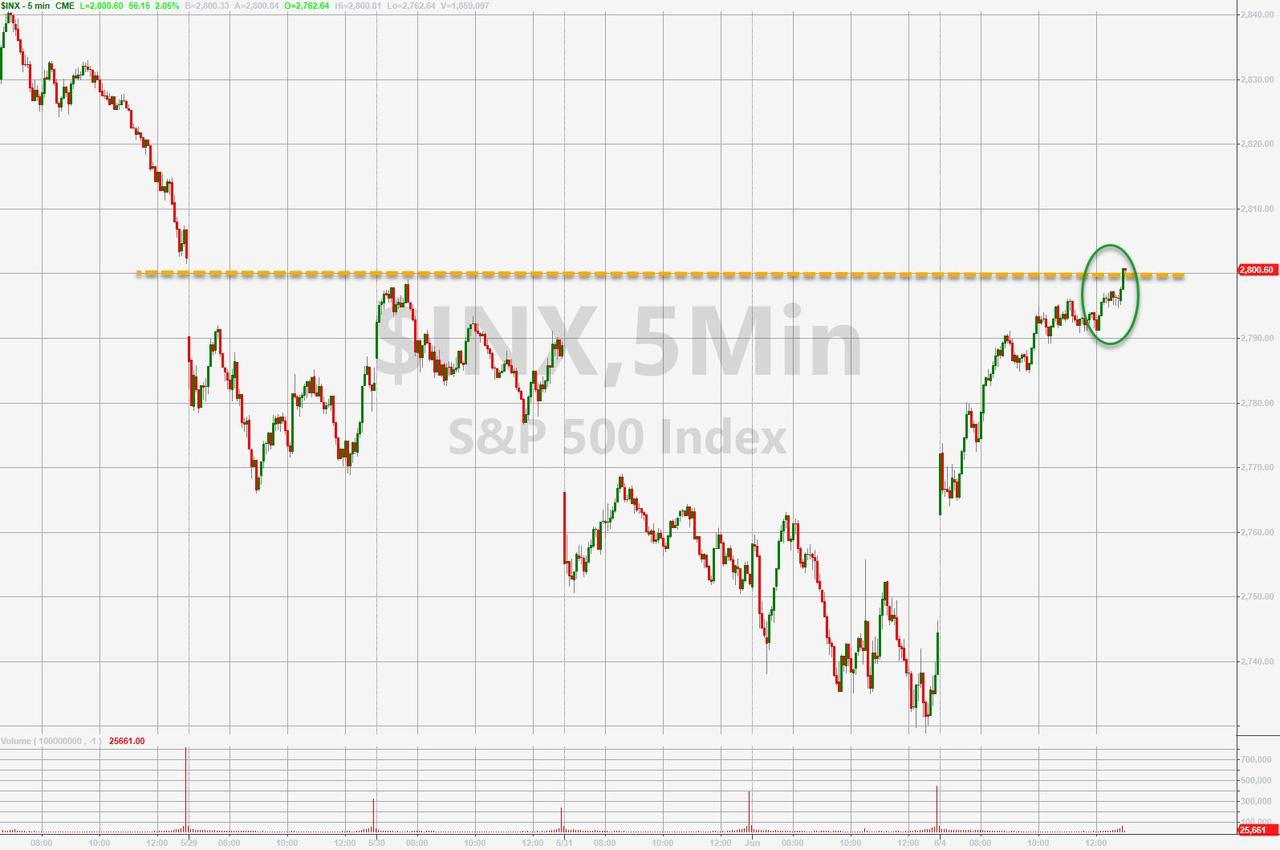
Does this chart look bullish? 16 months of nothing except the dividend, volatility, and acute anxiety. The S&P 500 has crossed above and below the 2,800 threshold no fewer than 19x since first testing the milestone in Jan/18. Looks like an elongated topping formation to me.

I could not have said it better myself.

Read More

China And Fed Please Markets

Ulli Market Commentary Contact

[Chart courtesy of MarketWatch.com]

  1. Moving the markets

A couple of positive developments combined forces to help the market crawl out of a hole and ramp higher after the miserable month of May. The major indexes gained above 2%.

Getting things started right at the opening were these conciliatory words from China in regards to the recent trade war escalation:

  1. CHINA HOPES U.S. TO STOP WRONG DOINGS, MEET CHINA HALFWAY
  2. CHINA COMMERCE MINISTRY SAYS THE DIFFERENCES AND FRICTIONS BETWEEN CHINA AND THE U.S. SHOULD BE RESOLVED THROUGH DIALOGUE AND NEGOTIATIONS

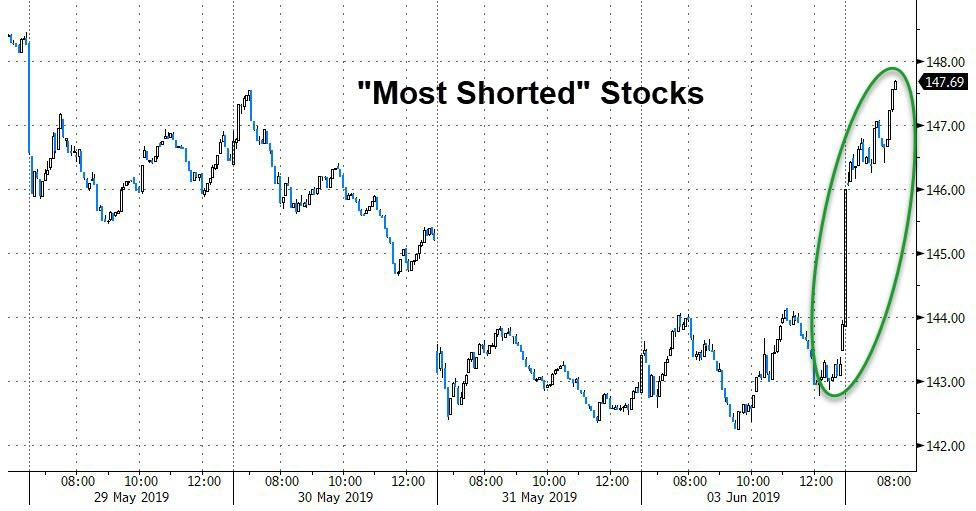
That was enough meat on the trade bone for the headline-scanning computer algos to send stocks sharply on a northerly direction. Along that path, we witnessed the biggest short-squeeze  since the first week of 2019.

To support an already positive day for the bulls, Fed chief Powell was interpreted by some traders as having admitted to open the door to a rate cut. He said that the Fed would “act as appropriate” to sustain the expansion. These remarks came after Fed President Bullard uttered on Monday that rate cuts “may be warranted soon” given the international trade disputes.

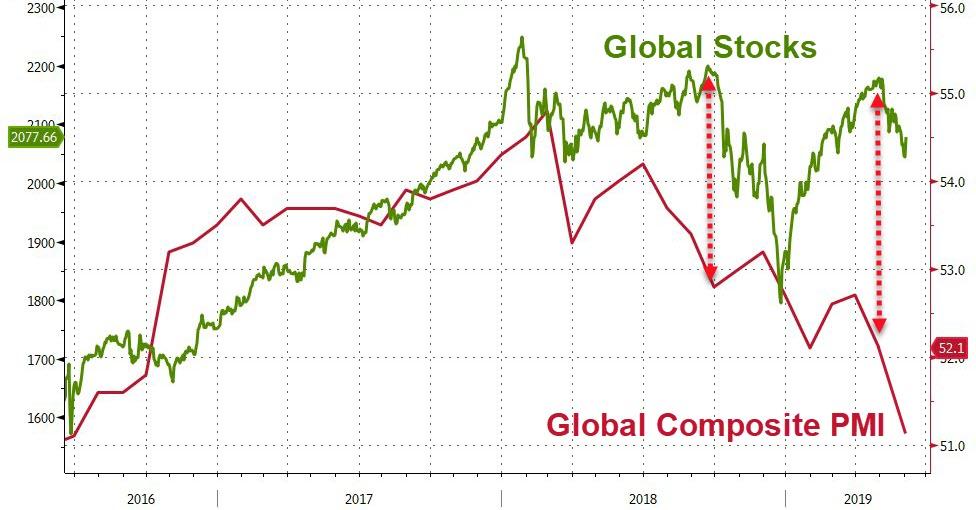
That’s all it took to push equities out of the doldrums, even as economic data points were anything but positive. We saw that global manufacturing contracted to a 7-year low, while U.S. factory orders showed the slowest growth since Trump’s election.

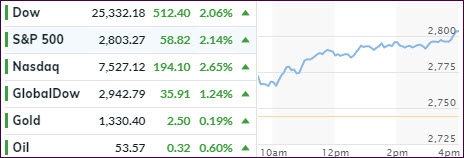
The S&P 500 managed to not only reclaim its 2,800 level but also its technically important 200-day M/A. The Dow climbed back above its 25k milestone marker, while the Nasdaq ended up wiping out some of its recent losses.

Lagging behind the S&P 500 today, but remaing ahead during this current Domestic Buy cycle, was the low volatilty ETF SPLV, which performs better when markets are mired in uncertainty and not shoot straight up, as we saw today.

At least for the moment, our Domestic TTI moved back into bullish territory after having danced around its trend line for the past week. The question remains as to whether today was an outlier or the resumption of the interrupted uptrend.  

Read More

Tech Sector Gets Rattled

Ulli Market Commentary Contact

[Chart courtesy of MarketWatch.com]

  1. Moving the markets

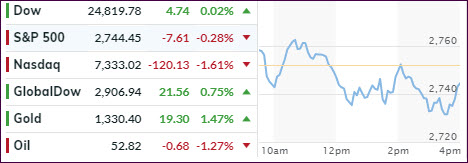
Tech stocks took a tumble and dragged the overall market down with some damage control setting in during the last 30 minutes of the session.

Global tariff fears, along with reports that the Trump administration has launched a multi-pronged anti-trust battle against big tech due to possible anti-trust violations, created enough uncertainty to keep any bullish momentum in check.

Additionally, bond yields continued to plunge with the 10-year deepening its inversion against the 3-month T-Bill, a scenario that has accurately predicted economic recessions in the past.

Not helping matters were increased worries regarding the intensification of the U.S. trade frictions with China and Mexico, to which India has been added, while rumor has it that Australia may be on deck.

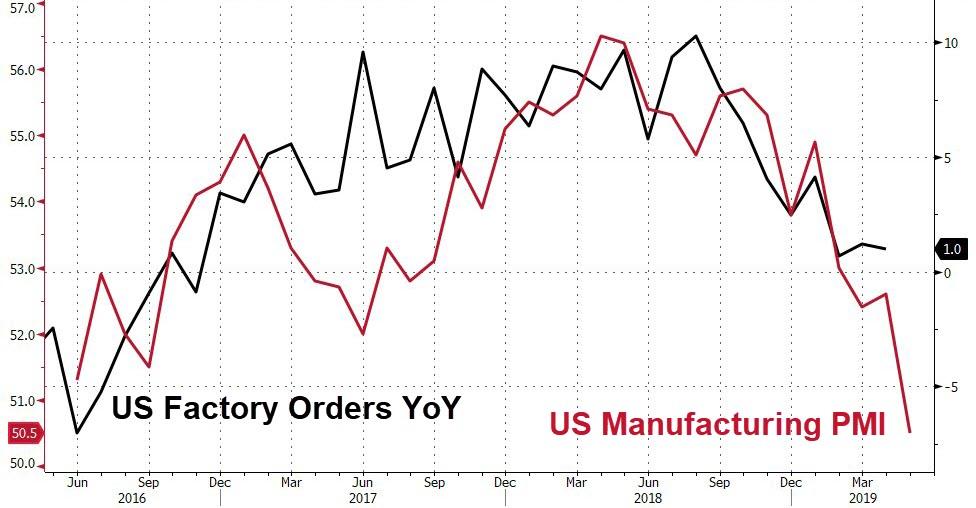
Domestically, the manufacturing soft survey data tumbled last month with the headline PMI falling to its lowest level since September 2009, as output growth eased considerably, which is not exactly awe inspiring, as this chart shows.  

Besides the carnage in tech, the losses were modest with our Domestic TTI improving, which means a potentail ‘Sell’ signal has been averted for the time being.

Read More

ETFs On The Cutline – Updated Through 05/31/2019

Ulli ETFs on the Cutline Contact

Below, please find the latest High-Volume ETF Cutline report, which shows how far above or below their respective long-term trend lines (39-week SMA) my currently tracked ETFs are positioned.

This report covers the HV ETF Master List from Thursday’s StatSheet and includes 322 High Volume ETFs, defined as those with an average daily volume of more than $5 million, of which currently 145 (last week 203) are hovering in bullish territory. The yellow line separates those ETFs that are positioned above their trend line (%M/A) from those that have dropped below it.

Take a look:                                                                   

The HV ETF Master Cutline Report

In case you are not familiar with some of the terminology used in the reports, please read the Glossary of Terms. If you missed the original post about the Cutline approach, you can read it here.