
- Moving the markets
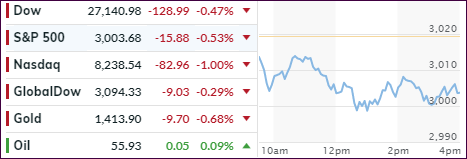
There was not much upward momentum to be found in the equities markets, as Europe set the negative tone early on with all indicators sliding into the red. The major indexes followed suit and never came close to breaking above their respective unchanged lines.
The retreat came in the face of a busy earnings day, which featured mainly disappointments, which weighed heavy on sentiment despite prospective interest rate cuts from the ECB.
The Nasdaq was hardest hit after Tesla (-15%) failed to meet expectations, which dragged tech-related stocks down with it. Others that did not fare well included Facebook, Boeing and Ford.
Even those companies that reported better than expected earnings seem to be affecting traders’ mood negatively, as they are hesitant to raise guidance and are lowering second half estimates due to the disruption experienced by current trade policies.
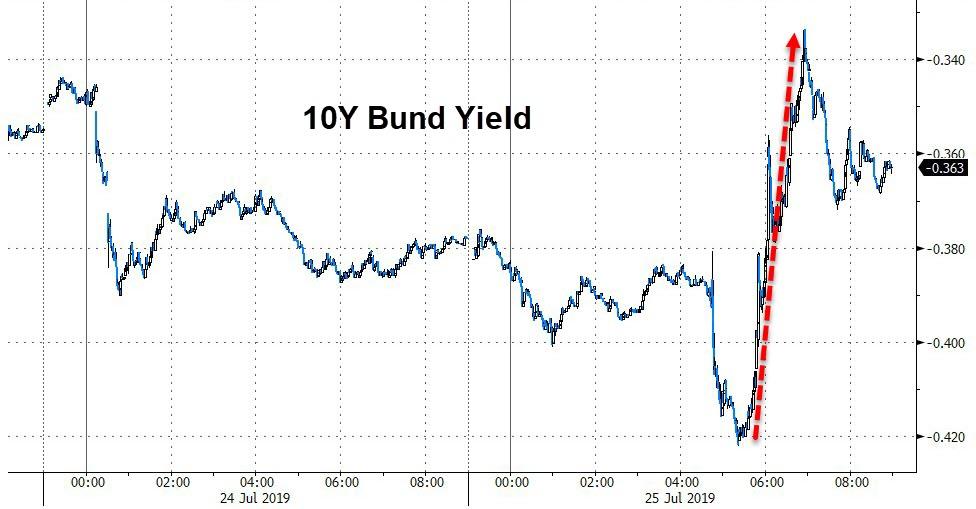
Bond yields rose today with the 10-year gaining some 2.7 basis points to close at 2.08%. If that sounds ridiculously low to you, take a look at the other side of the Atlantic where the German 10-year bond now has crashed to record lows to -0.41% before rebounding into the close.
At its lowest point, it means you can expect to lose -0.41% every year for 10 years on your investment, when at least in the U.S. you will earn +2.08% per annum. If you think this is simply nuts, you are correct. It’s nothing but financial engineering at its finest.
2. ETFs in the Spotlight
In case you missed the announcement and description of this section, you can read it here again.
It features 10 broadly diversified and sector ETFs from my HighVolume list as posted every Saturday. Furthermore, they are screened for the lowest MaxDD% number meaning they have been showing better resistance to temporary sell offs than all others over the past year.
The below table simply demonstrates the magnitude with which some of the ETFs are fluctuating regarding their positions above or below their respective individual trend lines (%+/-M/A). A break below, represented by a negative number, shows weakness, while a break above, represented by a positive percentage, shows strength.
For hundreds of ETF choices, be sure to reference Thursday’s StatSheet.
For this current domestic “Buy” cycle, here’s how some our candidates have fared:
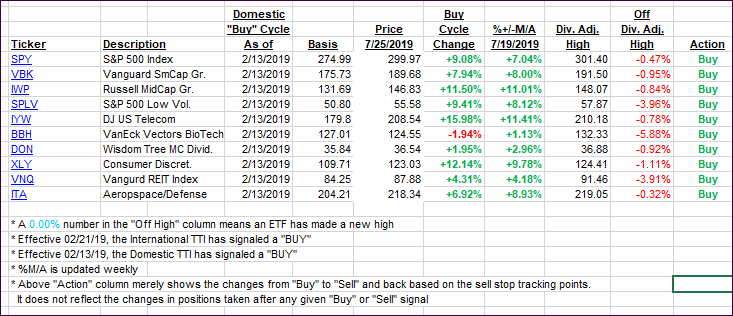
Again, the %+/-M/A column above shows the position of the various ETFs in relation to their respective long-term trend lines, while the trailing sell stops are being tracked in the “Off High” column. The “Action” column will signal a “Sell” once the -8% point has been taken out in the “Off High” column. For more volatile sector ETFs, the trigger point is -10%.
3. Trend Tracking Indexes (TTIs)
Our Trend Tracking Indexes (TTIs) slipped as markets failed to stage a sustainable rally.
Here’s how we closed 07/25/2019:
Domestic TTI: +7.68% above its M/A (last close +8.41%)—Buy signal effective 02/13/2019
International TTI: +4.54% above its M/A (last close +4.84%)—Buy signal effective 06/19/2019
Disclosure: I am obliged to inform you that I, as well as my advisory clients, own some of the ETFs listed in the above table. Furthermore, they do not represent a specific investment recommendation for you, they merely show which ETFs from the universe I track are falling within the specified guidelines.
Contact Ulli