A Historical Day: The Longest Manipulated Bull Market Is Over

Ulli Market Commentary Contact

[Chart courtesy of MarketWatch.com]
  1. Moving the markets

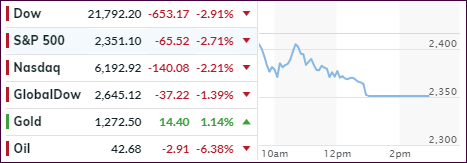
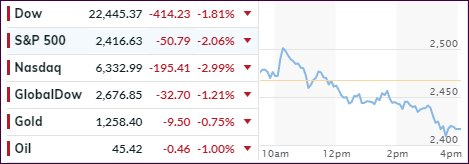
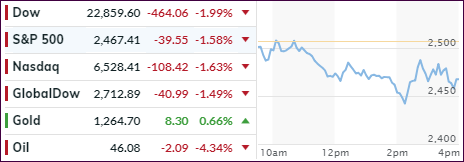
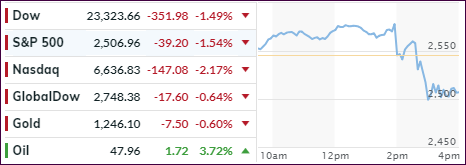
Even a Holiday shortened session wasn’t enough to give the bullish crowd some hope, as the major indexes plunged again with the S&P 500 finally dropping into bear market territory, a level defined as a 20% drop from recent highs.

Starting this mess was Treasury Secretary Mnuchin who, while on vacation, decided to call the heads of the six largest US banks on Sunday to assure them that there was plenty of liquidity in the system. He then proceeded set up a meeting with Plunge Protection Team (PPT) – on Christmas eve! Unfortunately, he also decided to tweet about it, which was akin to someone yelling “FIRE” in a crowed theater.

The fallout was immediate with the markets retreating, when a sudden rebound (PPT?) pushed the Nasdaq back above the unchanged line, before heavy selling set in, which sent the Dow down some 650 points. Good thing we had an abbreviated session, or the consequences could have been a lot worse.

As I pointed out before, this is now the worst December for the S&P 500 since the Great Depression (1931), and there are still 4 trading days left, which might create some problems for those who have not moved to the sidelines yet, as exit doors are getting increasingly crowded. You could consider this session to be a bloodbath, since volume was just about double of the recent average.

ZH noted that even the traditional safe-haven stocks were pummeled with the S&P 500 utilities index dropping as much as 4.6% intra-day, the most since August 2011, because of the continued threat of higher interest rates. That’s why cash on the sidelines never looked so good.

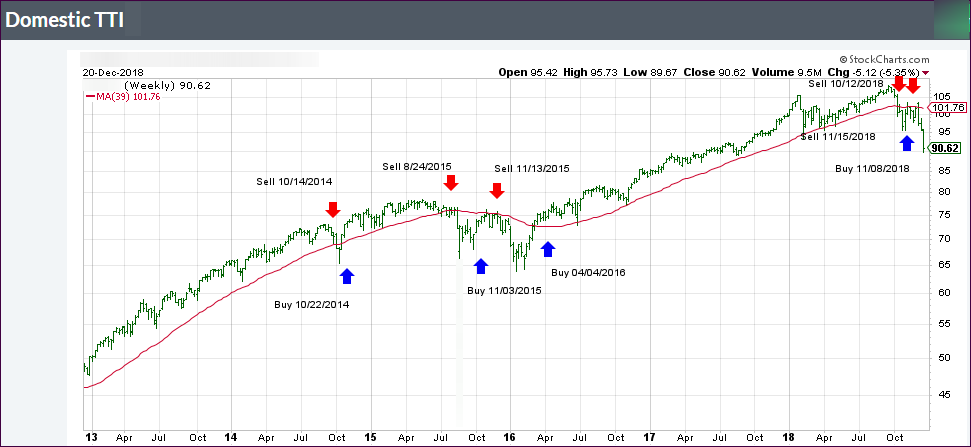
No one saw this market disaster coming except for our Domestic Trend Tracking Index (TTI), which generated a “Sell” effective 11/15/18. Since that moment in time, the S&P 500 has now lost -14.16% allowing all clients in my advisor practice to sidestep this financial tragedy, while the Buy-and-Hold crowd seems to end up with the short end of the stick again—for the third time this century.

Although I expect some sort of rebound make its presence felt, it will most likely only be a bounce in an ongoing bear market, which I believe has a long way to go.

I wish you a Merry Christmas!

Read More

ETFs On The Cutline – Updated Through 12/21/2018

Ulli ETFs on the Cutline Contact

Below, please find the latest High-Volume ETF Cutline report, which shows how far above or below their respective long-term trend lines (39-week SMA) my currently tracked ETFs are positioned.

This report covers the HV ETF Master List from Thursday’s StatSheet and includes 322 High Volume ETFs, defined as those with an average daily volume of more than $5 million, of which currently 43 (last week 48) are hovering in bullish territory. The yellow line separates those ETFs that are positioned above their trend line (%M/A) from those that have dropped below it.

Take a look:

The HV ETF Master Cutline Report

In case you are not familiar with some of the terminology used in the reports, please read the Glossary of Terms.

If you missed the original post about the Cutline approach, you can read it here.

ETF Tracker Newsletter For December 21, 2018

Ulli ETF Tracker Contact

ETF Tracker StatSheet

https://theetfbully.com/2018/12/weekly-statsheet-for-the-etf-tracker-newsletter-updated-through-12-20-2018/

MARKETS END A MISERABLE WEEK IN A SEA OF RED

[Chart courtesy of MarketWatch.com]
  1. Moving the markets

Here we go again. An early bounce ran into resistance, as bears upheld their dominance and sent the major indexes into a tailspin with the Dow registering another 400-point loss leaving some traders stunned and speechless. That’s no surprise to me, as most participants haven’t been around long enough to know what causes bear markets, how to identify one and how to stay out of harms way.

It was an ugly week with the Dow and S&P 500 down around -7% (yes, that is for the week!) while the Nasdaq (and SmallCaps) tumbled a more dramatic -8.4%. The tech index has now officially slipped into a bear market, which is defined as a drop of at least 20% from its recent high.

ZH adds that this was the worst week for the Dow and Nasdaq since October 2008 and the worst week for the S&P 500 since August 2011. All three indexes have now closed lower the last 5 out of 6 weeks:

From the 52-week highs:

  1. Dow -16%
  2. S&P -17%
  3. Nasdaq 100 -21% – BEAR
  4. Nasdaq Composite -22% – BEAR
  5. Trannies -23.6% – BEAR
  6. Small Caps -26% – BEAR

The culprits taking the starch out of the early rebound were the same with fears of a partial government shutdown, slowing global growth and rising interest rates taking top billing.

Then Fed governor Williams came out to try to jawbone the markets higher, which worked for a while until his comment “the balance sheet runoff is on auto-pilot,” reversed the modest rally.

Not to be outdone, Trump’s trade advisor Peter Navarro chimed in that a “trade pact with China within 90 days may prove to be difficult.” That appeared to be the final nail in the bullish coffin and down we went. This graph depicts precisely the market reaction to Williams and Navarro.

At this time it seems that the Smart Money indicator is spot on meaning things could get really ugly from here. Sure, we’re bound to see a rebound with legs that holds short-term, but the major trend remains bearish until my TTIs prove otherwise.

As of today, the S&P 500 has tumbled -11.84% since the effective date of our Domestic “Sell” signal on 11/15/2018.

Read More

Weekly StatSheet For The ETF Tracker Newsletter – Updated Through 12/20/2018

Ulli ETF StatSheet Contact

ETF Data updated through Thursday, December 20, 2018

Methodology/Use of this StatSheet:

  1. From the universe of over 1,800 ETFs, I have selected only those with a trading volume of over $5 million per day (HV ETFs), so that liquidity and a small bid/ask spread are assured.
  2. Trend Tracking Indexes (TTIs)

Buy or Sell decisions for Domestic and International ETFs (section 1 and 2), are made based on the respective TTI and its position either above or below its long-term M/A (Moving Average). A crossing of the trend line from below accompanied by some staying power above constitutes a “Buy” signal. Conversely, a clear break below the line constitutes a “Sell” signal. Additionally, I use a 7.5% trailing stop loss on all positions in these categories to control downside risk.

  1. All other investment arenas do not have a TTI and should be traded based on the position of the individual ETF relative to its own respective trend line (%M/A). That’s why those signals are referred to as a “Selective Buy.” In other words, if an ETF crosses its own trendline to the upside, a “Buy” signal is generated. Since these areas tend to be more volatile, I recommend a wider trailing sell stop of 7.5% -10% depending on your risk tolerance.

If you are unfamiliar with some of the terminology, please see Glossary of Terms and new subscriber information in section 9.


  1. DOMESTIC EQUITY ETFs: SELL — since 11/15/2018

Click on chart to enlarge

Our main directional indicator, the Domestic Trend Tracking Index (TTI-green line in the above chart) is now positioned below its long-term trend line (red) by -11.08% after having generated a new Domestic “Sell” signal effective 11/15/18 as posted.

Read More

Ferocious Bears In Charge: Markets Get Mauled

Ulli Market Commentary Contact

[Chart courtesy of MarketWatch.com]
  1. Moving the markets

There was simply no hope at all for the bulls today, as we headed south right after the opening bell. Not helping the anxiety among traders were news that Trump was reluctant to sign a bill that would extend funding for the government to avoid a partial shutdown. That remark took the major indexes down another notch.

The edgy market mood continued when the Nasdaq dropped some -2.1% and came within striking distance of touching its bear market level, defined as a drop of -20% from recent highs.

I am sure that critical point will be breached, especially since the Fed announced the shrinkage of its balance sheet to be on “auto pilot.” Translation: Stocks are on their own for the first time in a decade, as the Fed pursues its Quantitative Tightening. Not a good outlook for the bulls…

Then hedge fund guru David Tepper opined that the “Fed’s lifeline is gone,” referring to the assumed Fed “put” that allowed markets to only sink to a certain level, before they would step in and rescue equity investors via their various QE programs. That’s one of the reasons why we have not seen any bear markets since 2009. During that period, I identified several of them, but they all were magically saved by sudden bullish sentiment.

Adding to the miserable mood on Wall Street was the Fed’s Dudley when he chimed in by adding that “The Fed is not there to take away the market’s pain,” and that “The Fed does not care about market prices for themselves.”

Wow, you can’t be any more direct than that…

In the end, it was another ugly day with the major indexes now down -10% for the month, while Transportations and SmallCaps fared even worse.

How low can we go?

This chart of the tightening of financial conditions index suggests another 300 points on the S&P, at least for right now. However, other forecasts I have seen point to much lower levels.

It’s good not to participate in this financial disaster with $16.7 trillion of market cap having been erased from global stock markets this year. Ouch!

Read More

Fed Hikes And Bulls Strike, As Markets Tank—Again

Ulli Market Commentary Contact

[Chart courtesy of MarketWatch.com]
  1. Moving the markets

The Fed did not cave to recent public pressure exerted by politicians and Wall Street traders but stayed the course and hiked rates ¼%, while also predicting another possible two increases next year down from the previously announced three.

While two is better than three, at least in the minds of traders, this was not as dovish an announcement as was expected, so the markets took the path of least resistance, which was “down.” In the process, not only were the early hopeful gains (the Dow traded in a 900-point range) wiped out “again,” but the S&P 500 also made new lows for the year while killing any remaining bullish sentiment for the time being.

The Transportation ETF (IYT) was the latest victim to plunge into bear market territory, as it gave back -3.11% to close -20.9% below its September record. Maybe that’s why a FedEx outlook suggested a severe global recession to be on the horizon.

Across markets, banks were clobbered to their lowest since November 2016 and high-yield bond prices got hammered the most in 8 months to the lowest since April 2016, according to ZH. This is the market’s worst year since 2008, worst quarter since Q4 2008 and worst December since 1931!

As Trend Trackers, we’re happy to watch this debacle from the sidelines. As a point of interest, since the effective date of our domestic Sell signal on 11/15/18, the S&P 500 has now lost -8.05%.

Read More