
- Moving the markets
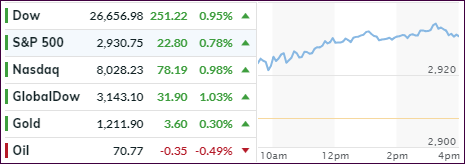
It took a while, but the Dow finally managed to take out its January high to close in record territory, while the S&P 500 scored its first record since August. The Nasdaq fared well today and moved to within 1.3% off its all-time high, made in August as well.
Economic data took some of the credit for the bullish burst with first-time jobless claims falling and the Fed manufacturing index jumping more than expected. Existing homes sales were the laggard by remaining unchanged in August from the prior month, which was a disappointment as this occurred during the height of the “selling” season. But, as we’ve seen before, bad news will/can be simply ignored in order not upset the bullish theme.
Never mind that nothing has changed regarding the US/China trade war but, here too, it’s more convenient for traders to remain complacent and disregard the mounting frictions. I think that the tariff problems will not go away and most likely move to front and center again when least expected. However, right now they have not been able to take the starch out of upward momentum, so we’ll stay aboard and enjoy the bullish ride for as long as it lasts.
Assisting upward momentum were interest rates, which dropped for a change with the 10-year bond yield coming off its recent high by closing down 2 basis points to 3.065%. The US dollar continued its recent slide by round-tripping but ending off the lows for the day.
- ETFs in the Spotlight
In case you missed the announcement and description of this section, you can read it here again.
It features 10 broadly diversified and sector ETFs from my HighVolume list as posted every Saturday. Furthermore, they are screened for the lowest MaxDD% number meaning they have been showing better resistance to temporary sell offs than all others over the past year.
The below table simply demonstrates the magnitude with which some of the ETFs are fluctuating regarding their positions above or below their respective individual trend lines (%M/A). A break below, represented by a negative number, shows weakness, while a break above, represented by a positive percentage, shows strength.
For hundreds of ETF choices, be sure to reference Thursday’s StatSheet.
Year to date, here’s how our candidates have fared so far:
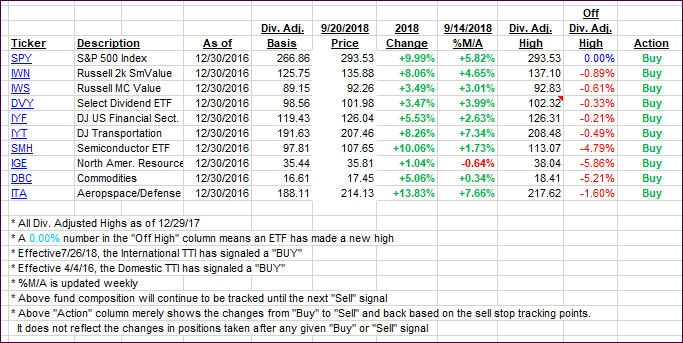
Again, the %M/A column above shows the position of the various ETFs in relation to their respective long-term trend lines, while the trailing sell stops are being tracked in the “Off High” column. The “Action” column will signal a “Sell” once the -8% point has been taken out in the “Off High” column. For more volatile sector ETFs, the trigger point is -10%.
- Trend Tracking Indexes (TTIs)
Our Trend Tracking Indexes (TTIs) jumped deeper into bullish territory as green was the color of the day.
Here’s how we closed 09/20/2018:
Domestic TTI: +6.01% above its M/A (last close +5.34%)—Buy signal effective 4/4/2016
International TTI: +1.98% above its M/A (last close +0.97%)—Buy signal effective 7/26/2018
Disclosure: I am obliged to inform you that I, as well as my advisory clients, own some of the ETFs listed in the above table. Furthermore, they do not represent a specific investment recommendation for you, they merely show which ETFs from the universe I track are falling within the guidelines specified.
Contact Ulli