ETF Tracker StatSheet
https://theetfbully.com/2019/01/weekly-statsheet-for-the-etf-tracker-newsletter-updated-through-01-10-2019/
SNAPPING THE WIN STREAK BUT GAINING FOR THE WEEK
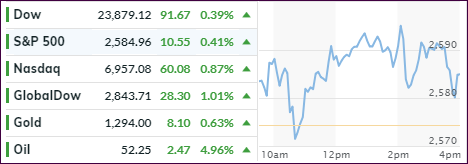
[Chart courtesy of MarketWatch.com]
- Moving the markets
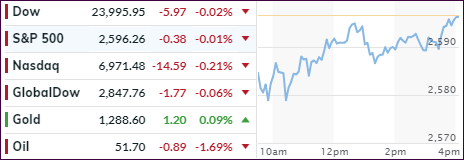
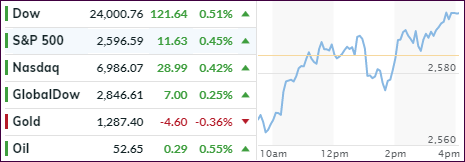
Today was almost a repeat from yesterday’s session in that we started sharply to the downside, but bullish momentum appeared and pulled the major indexes up, but they fell a tad short of crossing above the unchanged line.
For the week, the Dow gained 2.4%, the S&P 500 ended up 2.5% while the Nasdaq took top billing with +3.5%. While these were nice advances, remember that they are not actual gains but merely represent a making up of some of the losses sustained by the Buy-and-Hold crowd, since our last Sell signal became effective on 11/15/18.
Since that date, the S&P 500 (SPY), for example, is still down -5.14%, which means that this exact percentage gain is required for those who stayed invested to get back to “even” when compared to the Trend Tracking strategy. So, the headlines that “the stock market just got off to its best start in 13 years” conveniently forgets that Q4 2018 was on the of the worst ever with the S&P 500 surrendering -14% thereby neutralizing the effect of this “best start.”
Potential bull markets start in bear market territory and vice versa meaning that the rebound of the last few weeks should come as no surprise. Slumping macro data, tumbling earnings expectations and the Fed’s balance sheet reductions, however, are headwinds that computer algos, who control most of the trading, simply ignored but which still need to be dealt with.
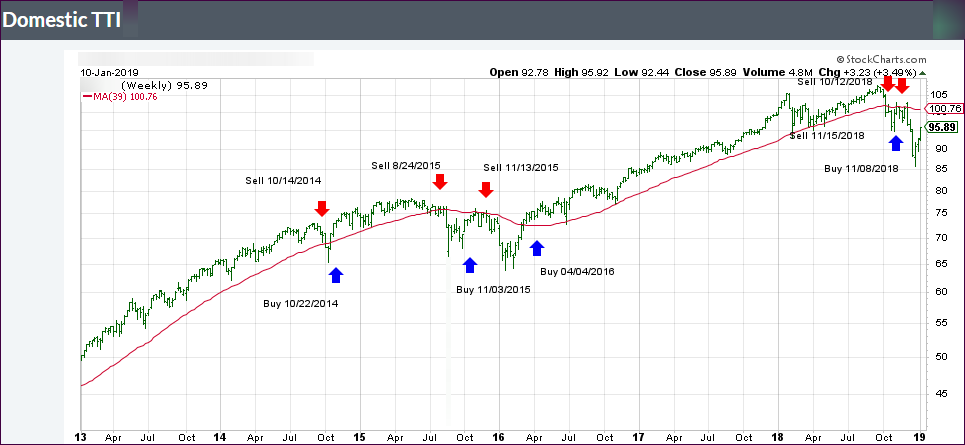
However, it’s questionable at this moment in time whether there are enough catalysts available to keep upward momentum going to a point, where a new bull market starts and our Trend Tracking Indexes (TTIs) give the go ahead. Right now, it would take another +5% advance of our Domestic TTI to cross above its long-term trend line.
With the markets see-sawing and moving violently daily, any outcome is possible, no matter how unlikely or improbable. The current positive market theme could continue or end with a sudden bang. No one has the answer, despite many MSM headlines proclaiming that they do. It’s best not to get suckered into making emotional decisions, which for me means tracking our TTIs and waiting patiently for a new “Buy” signal to develop.
Read More
