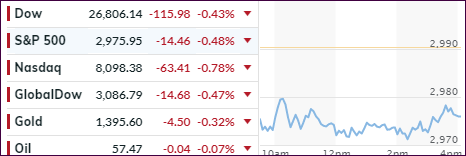
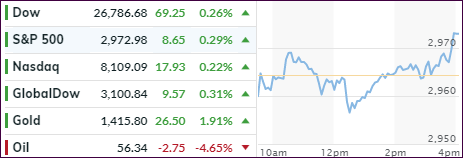
All session long, the major
indexes were stuck below their respective unchanged lines, as uncertainty about
the much anticipated and expected rated cut by the Fed later this month kept equities
in check.
After all, we are only a few
steps away from all-time highs, traders believe we are in a strong economic environment,
despite evidence to the contrary, and want a rate cut so that stocks can continue
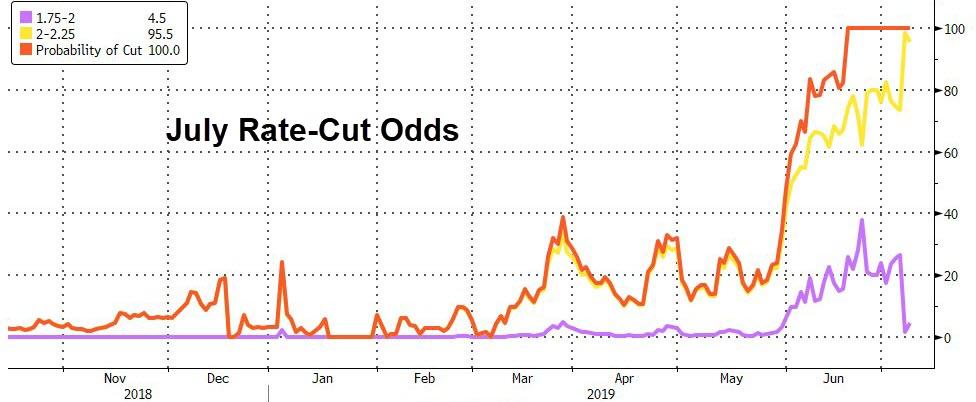
to rise ad infinitum. The July rate-cut odds remain at 100%, as this
chart shows.
Besides rate cut hopes being
questioned, all eyes are on Fed chair Powell on Wednesday when he testifies
before Congress on the state of the US economy as well as monetary policy. He
will then also speak before the Senate on Thursday, but most likely his speech will
be a repeat. Nevertheless, every one of his words will be dissected to analyze
what he really meant to say.
In the stock arena, Boeing proved
to be a drag on the Dow, due to the Saudis cancelling a $5.5 billion order, while
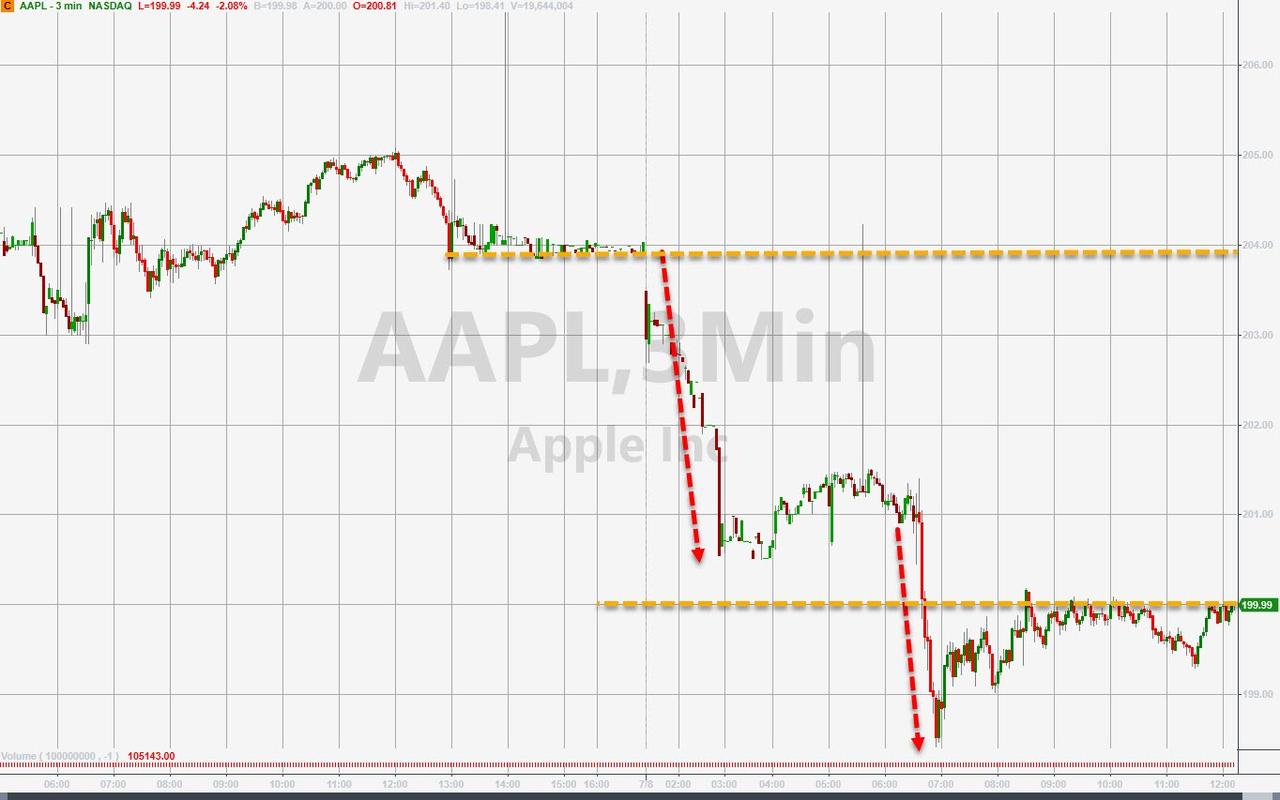
Apple
suffered as well, after an analyst downgraded the company from ‘neutral’ to ‘sell.’
Ouch!
With all the hype surrounding
the rate-cut scenario, I wonder what will happen to equities if the Fed disappoints
and does nothing? Consider, there is no Fed meeting in August, so the wait till
September could give the bears a reason to do some serious chest pounding.
Below, please find the latest High-Volume ETF Cutline
report, which shows how far above or below their respective long-term trend
lines (39-week SMA) my currently tracked ETFs are positioned.
This report covers the HV ETF Master List from Thursday’s
StatSheet and includes 322 High Volume ETFs, defined as those with an average
daily volume of more than $5 million, of which currently 279 (last week 276)
are hovering in bullish territory. The yellow line separates those ETFs that
are positioned above their trend line (%M/A) from those that have dropped below
it.
In case you are not familiar
with some of the terminology used in the reports, please read the Glossary of Terms.
If you missed the original
post about the Cutline approach, you can read it here.
GOOD NEWS IS BAD NEWS AGAIN—BOND YIELDS EXPLODE; EQUITIES
TUMBLE AND RECOVER
[Chart courtesy of MarketWatch.com]
Moving
the markets
As we’ve seen many times in the past, good economic
news turned out to be bad news for equities, which took a steep dive at the
opening after a better than expected jobs report. We learned that 224k new jobs
were added, which was an easy beat of the 170k expected.
Wall Street viewed this as a negative development
because it endangers, or at least puts in question, the widely anticipated rate
cut by the Fed later this month. At session lows, the Dow had dropped some -0.8%
with the other major indexes showing similar losses.
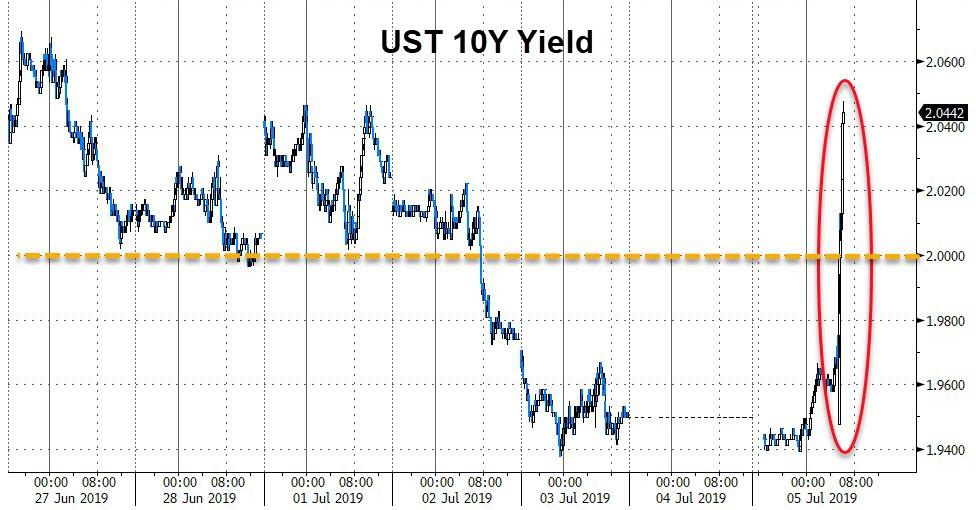
At the same time, bond yields, which had been on
a downward trajectory, exploded higher with the 10-year at one point being up 11
basis points and solidly back above the 2% level. That is a huge move, as this
chart demonstrates.
The ensuing rebound pulled yields back down a
tad, but we still closed higher by over 9 basis points, while in the equity arena
the losses were reduced sharply with only the safe- haven arena, namely gold,
suffered a loss of over 1%.
ZH summed up the week as follows:
Trade-Truce ‘good’ news was good
news for stocks, ‘bad’ news in macro data this week was good for
stocks, and jobs ‘good’ news today was bad news for stocks
(initially)…
Be that as it may, despite a Holiday shortened week,
the major indexes closed higher with the S&P 500 adding +1.7%. Of course, it
all happened on low volume, so we’ll have to wait till Monday, when the big boys
return, and we’ll find out if there is more fallout from today’s jobs report waiting
in the wings.
1. From the universe of over 1,800 ETFs, I have selected only those with a
trading volume of over $5 million per day (HV ETFs), so that liquidity and a
small bid/ask spread are assured.
2. Trend Tracking Indexes (TTIs)
Buy or Sell decisions for Domestic and International ETFs (section 1 and
2), are made based on the respective TTI and its position either above or below
its long-term M/A (Moving Average). A crossing of the trend line from below
accompanied by some staying power above constitutes a “Buy” signal. Conversely,
a clear break below the line constitutes a “Sell” signal. Additionally, I use a
7.5% trailing stop loss on all positions in these categories to control
downside risk.
3. All other investment arenas do not have a TTI and should be traded
based on the position of the individual
ETF relative to its own respective trend line (%M/A). That’s why those signals
are referred to as a “Selective Buy.” In other words, if an ETF crosses its own
trendline to the upside, a “Buy” signal is generated. Since these areas tend to
be more volatile, I recommend a wider trailing sell stop of 7.5% -10% depending
on your risk tolerance.
If you are unfamiliar with some of the terminology, please see Glossary of Termsand new subscriber information in section 9.
1. DOMESTIC EQUITY ETFs: BUY
— since 02/13/2019
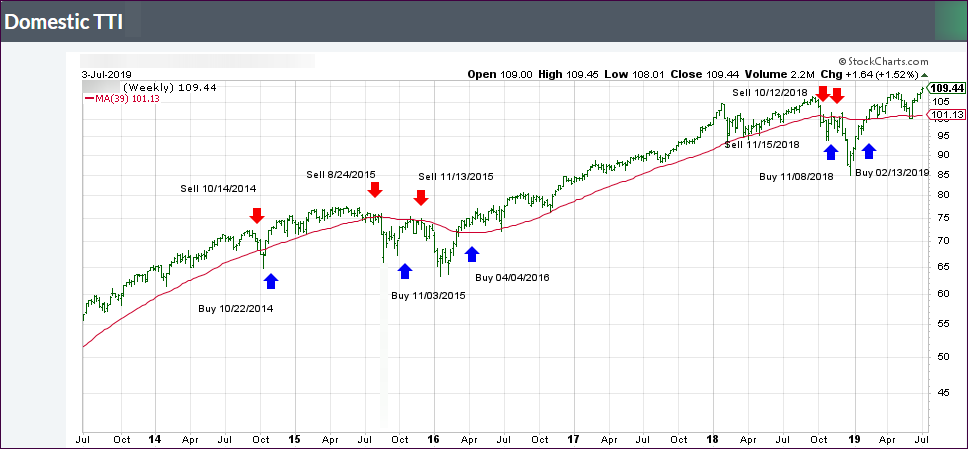
Click on chart to enlarge
Our main directional indicator, the Domestic Trend Tracking Index (TTI-green line in the above chart) is now positioned above its long-term trend line (red) by +8.37% after having generated a new Domestic “Buy” signal effective 2/13/19 as posted.
The link
below shows all High Volume (HV) Domestic Equity ETFs. The sorting order is by
M-Index ranking. Prices in all linked tables below are updated through 07/03/2019,
unless otherwise noted. Price data not yet available at publication is
indicated with 00.00% or -100.00%. Please note that distributions are not
included in the current momentum numbers.
Whenever the
TTI is above the trend line, and therefore in “Buy” mode, you can either use
the tables in the link below to make your selections or choose from the 10 ETFs
in the Spotlight, which are featured daily as part of the market commentary:
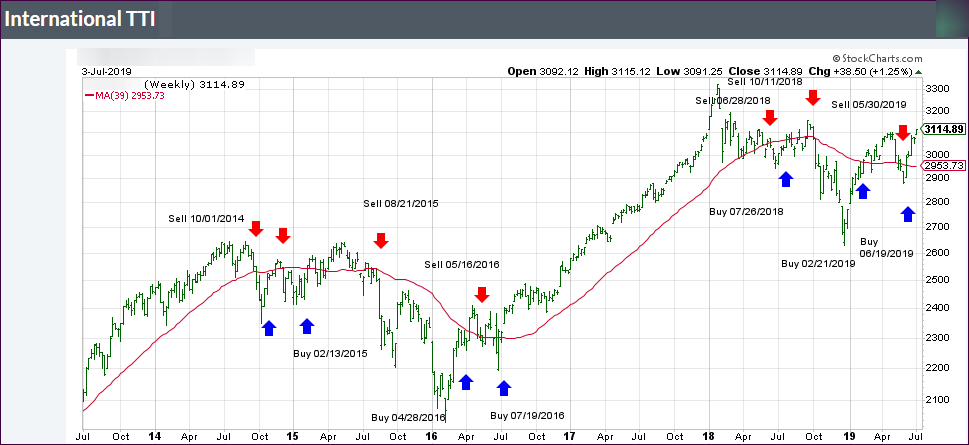
The
International Trend Tracking Index (green) has now moved +5.49% above its
long-term trend line (red). The new ‘Buy’ signal went into effect on 6/19/2019.
The listings
in the link below represent the High Volume (HV) International ETFs I track to
be used during a Buy cycle. They are sorted by M-Index ranking:
This ETF
Master list shows the total of all ETFs listed, which allows you to get a quick
overview of leaders and laggards. The sorting order is by M-Index. Momentum
figures for all ETFs are not adjusted for dividends.
The link below
contains a list of HV ETFs for countries/regions, which I am tracking weekly.
Please note that data in this table does not include adjustments due to
distributions.
Country
funds, especially over the past few years, have been volatile. So, the use of a
trailing stop loss (I use 10%) is imperative to protect your portfolio from
severe downside moves.
5. SECTOR ETFs: SELECTIVE
BUY
To diversify
our portfolios, we always need to look for different opportunities to invest
our money. The table of HV Sector ETF listings in the following link covers a
broad spectrum of possibilities. The sorting order is by M-Index:
Here too, I
recommend the use of a 10% trailing stop loss to minimize the risk.
6. BOND & DIVIDEND ETFs: SELECTIVE BUY
If you
prefer using ETFs for the generation of income, here’s a list of bond and
dividend paying ETFs. It’s important to first look at how these instruments
have held up in terms of momentum figures. Then you should visit your favorite
financial web site to examine yield and other details.
Please note
that data in this table does not include adjustments due to distributions.
Please note
that some of the above funds try to outperform the index they are tied to by
the percentage stated. While this can enhance your returns, it can certainly
accelerate your losses as well. No matter which way you choose, be sure to work
with a trailing sell stop (I suggest 10%) and be aware that volatility will be
your constant companion.
8. NEW SUBSCRIBER INFORMATION
To get a
head start on more successful investing, please click on:
In case you
missed it, you can download my latest e-book “How to beat the S&P 500…with
the S&P 500,” here. If you are investing
your 401k and must use mutual funds, I suggest you primarily stick with the
S&P 500 as described in my book. Of course, you can always use the above
tables to find sector or country ETFs to your liking and use the equivalent
mutual funds as offered by your custodian.
Disclosure:
I
am obliged to inform you that I, as well as my advisory clients, own some of
the ETFs listed in the above table. Furthermore, they do not represent a
specific investment recommendation for you, they merely show which ETFs from
the universe I track are falling within the guidelines specified.
Despite most Wall Street traders being gone this week,
the S&P 500 is heading towards its 3,000 level—on very low volume. With only
another hour to go, because of a shortened session, we may very well see this milestone
being hit.
I have a few commitments this afternoon and will not be able
to write today’s report. Regular posting will resume Friday.
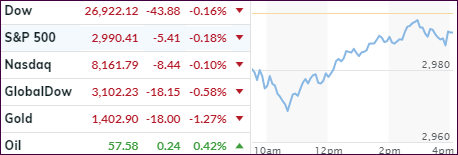
Moving around their respective unchanged lines was the
motto of the day, as fading optimism from the trade ceasefire kept bullish
momentum in check. However, in a repeat performance of yesterday, sudden buying
pressure during the last hour prevented the major indexes from closing in the
red, despite the short-squeeze
having run out of ammo.
While trade negotiations have begun again, “this will
take time, and we want to get it right,” said White House economic advisor Peter
Navarro. In other words, there are no low hanging fruit to pick, and the markets
will have to wait until positive news will provide a springboard for further equity
advances.
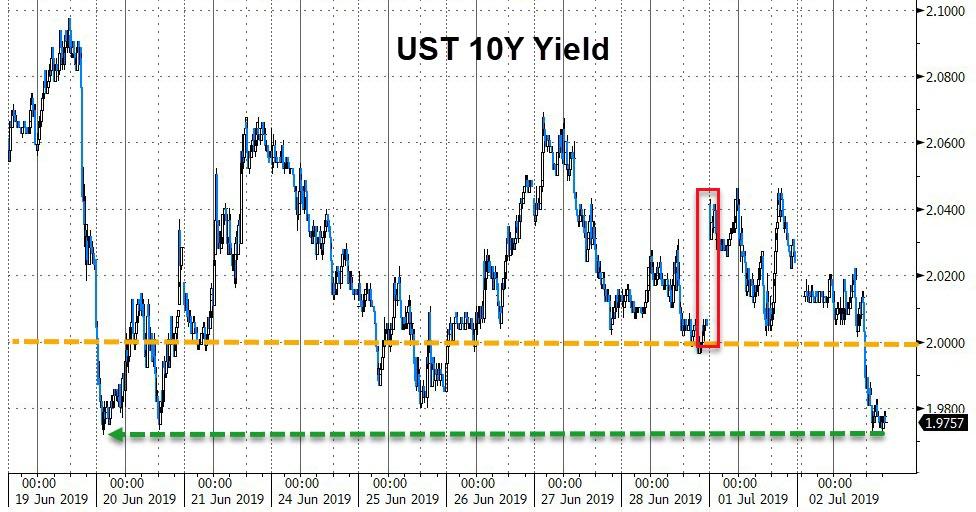
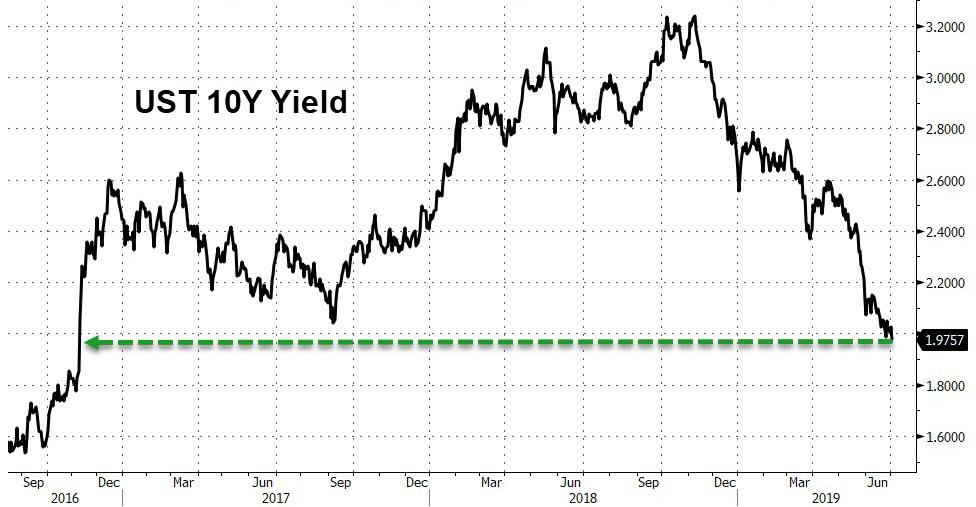
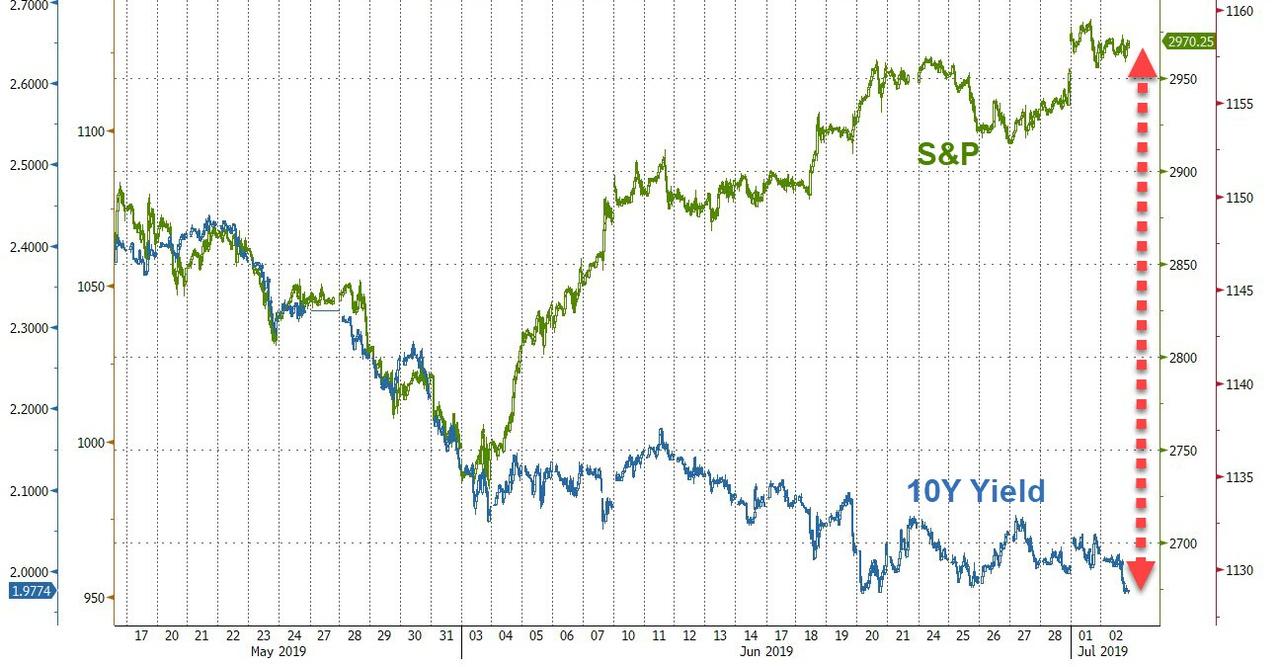
The 10-year bond yield tanked
again and not only dropped below the 2% level but held there at 1.975%, which was
its lowest
close since November 2016. That gave a nice assist to SPLV, which gained
+0.96% vs. SPY’s +0.26%.
With the S&P 500 pushing towards its 3k level, the markets
still assume for the Fed to step up to the plate and lower rates this month.
Expectations are 80% for 1/4% cut and 20% for a 0.5% cut. I find that hard to
believe due to the elevated level of the indexes. Last year, the Fed lowered
rates when equities were tanking and not when they were knocking on all-time
highs.
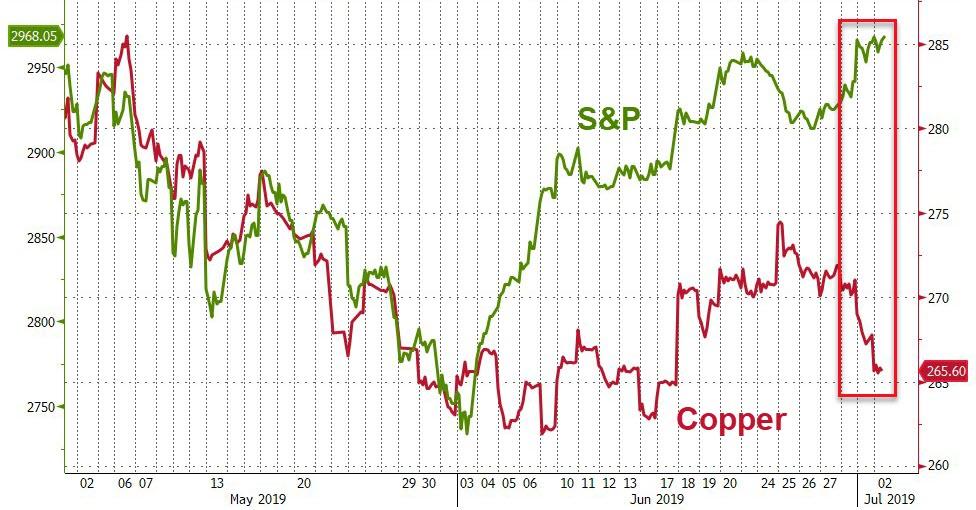
You may not know it, but the direction of Copper has indicated
reliably in the past where the economy is going. This chart
shows that we have a decoupling from equities. Just as the alligator
jaws are widening further, bond yields are painting an entirely different picture
from the route stocks are taking.