
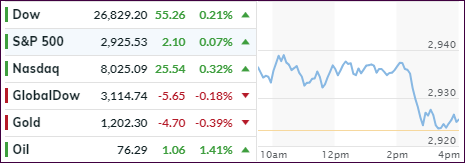
[Chart courtesy of MarketWatch.com]
- Moving the markets
As we’ve seen in the recent past, an early rally ran into overhead resistance, as prices slipped for the remainder of the session. However, the major indexes were able to close in the green by a fraction of a percent as the Dow scored another intra-day record.
The turnaround came early afternoon when bond yields suddenly rallied strongly with the 10-year spiking 9 basis points to close at 3.16%, its highest level since June 2011, while all other maturities rallied in similar fashion. That turned out to be the kill shot for equities and south we went. Fortunately, we ran out of trading time before breaking the unchanged line to the downside.
The widely held 20-year bond ETF (TLT) got clobbered, as it not only traded in a wide range but also gapped down as the chart shows. YTD, TLT has now lost -7.88%, a hefty amount given the more subdued nature of bonds over the past bullish cycle, which appears to slowly come to an end. With today’s loss, TLT has taken out the May’s lows and has reached its lowest level for 2018.
SmallCaps managed to buck the trend and rebounded with SCHA gaining +0.78%. The Dollar Index surged along with the higher bond yields to a level last seen in early August, while Italy’s bond yield eased on hopes that negotiations regarding future deficits may turn out to be successful.
I keep harping on bonds, because higher bond yields will eventually end the stock market euphoria and ultimately push the bullish crowd over the edge into the bear market trap. However, we are not at this point yet, so take my view just as a word of caution.
2. ETFs in the Spotlight
In case you missed the announcement and description of this section, you can read it here again.
It features 10 broadly diversified and sector ETFs from my HighVolume list as posted every Saturday. Furthermore, they are screened for the lowest MaxDD% number meaning they have been showing better resistance to temporary sell offs than all others over the past year.
The below table simply demonstrates the magnitude with which some of the ETFs are fluctuating regarding their positions above or below their respective individual trend lines (%M/A). A break below, represented by a negative number, shows weakness, while a break above, represented by a positive percentage, shows strength.
For hundreds of ETF choices, be sure to reference Thursday’s StatSheet.
Year to date, here’s how our candidates have fared so far:
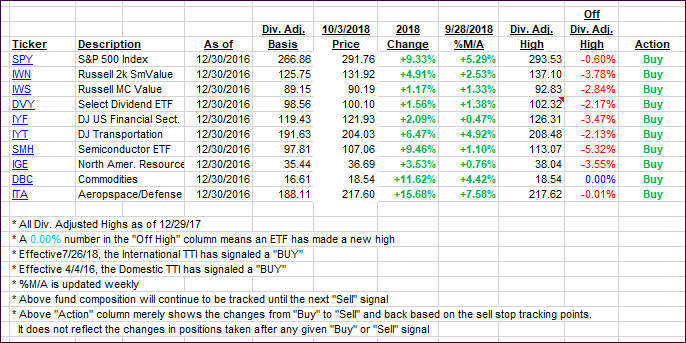
Again, the %M/A column above shows the position of the various ETFs in relation to their respective long-term trend lines, while the trailing sell stops are being tracked in the “Off High” column. The “Action” column will signal a “Sell” once the -8% point has been taken out in the “Off High” column. For more volatile sector ETFs, the trigger point is -10%.
3. Trend Tracking Indexes (TTIs)
Our Trend Tracking Indexes (TTIs) changed only immaterially.
Here’s how we closed 10/03/2018:
Domestic TTI: +4.26% above its M/A (last close +4.25%)—Buy signal effective 4/4/2016
International TTI: +0.96% above its M/A (last close +1.14%)—Buy signal effective 7/26/2018
Disclosure: I am obliged to inform you that I, as well as my advisory clients, own some of the ETFs listed in the above table. Furthermore, they do not represent a specific investment recommendation for you, they merely show which ETFs from the universe I track are falling within the guidelines specified.
Contact Ulli