
ETF Tracker StatSheet
U.S.-CHINA TRADE EUPHORIA POWERS MARKETS
- Moving the markets
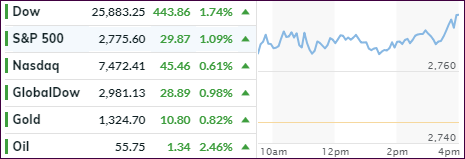
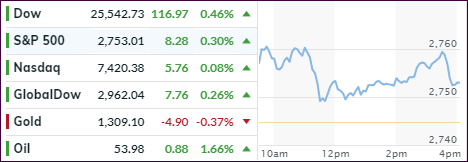
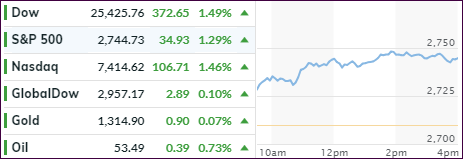
Hope and euphoria, that progress between the U.S. and China trade negotiators will continue, combined forces to drive the major indexes further into lofty territory.
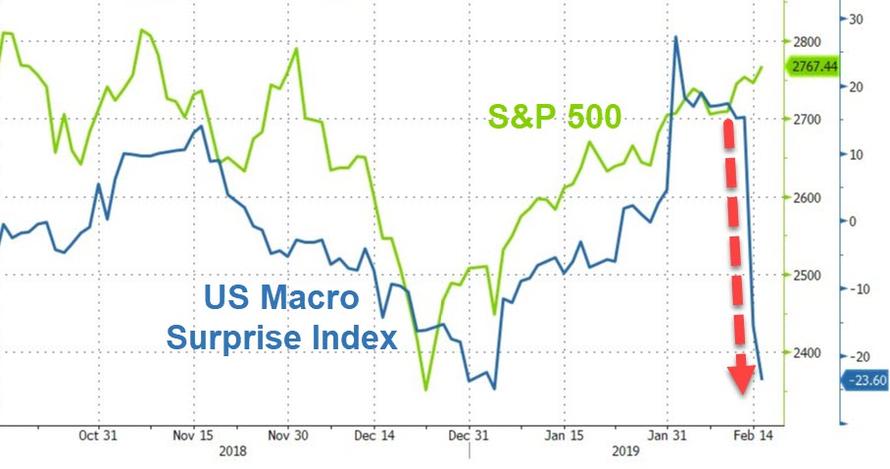
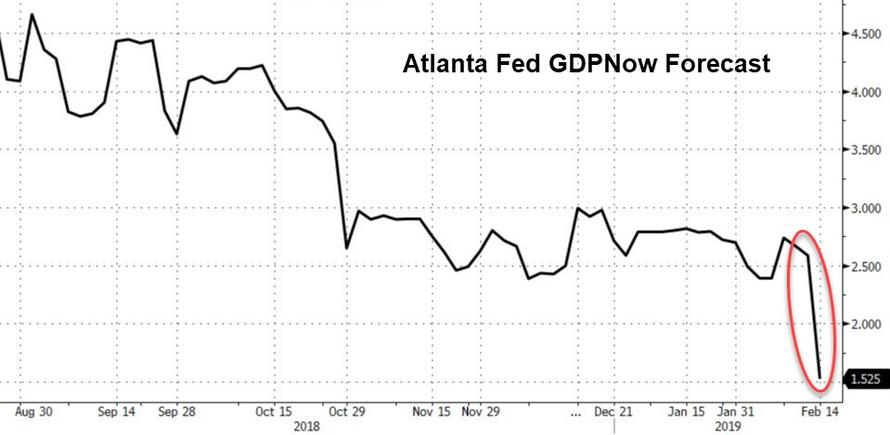
Fundamentals don’t seem to matter, and the potentially soft GDP number, in part caused by a collapse in retail sales, appears to be just an afterthought. Even the US Macro Surprise index did its best imitation of a swan dive thereby disconnecting from current market levels.
All that mattered today was expectations for further talks appear real, despite the warring parties being far apart on key trade issues. Nevertheless, negotiations concluded today and are set to resume next week in Washington, which was interpreted as a sign that both sides are eager to reach a settlement prior to the March 1 deadline.
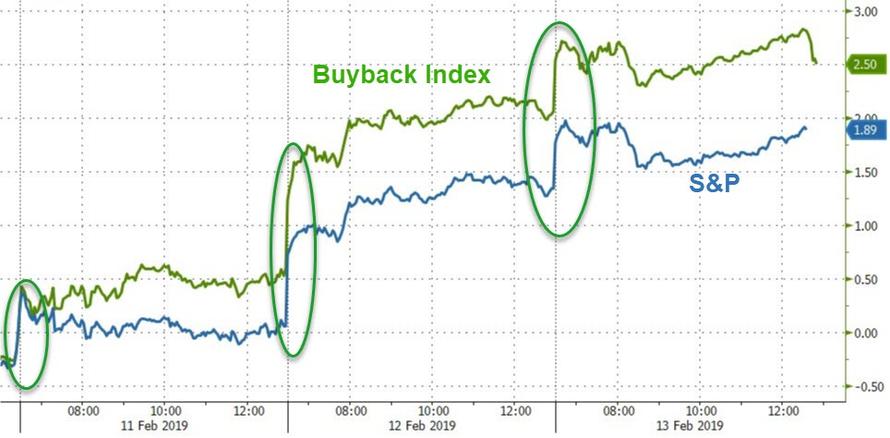
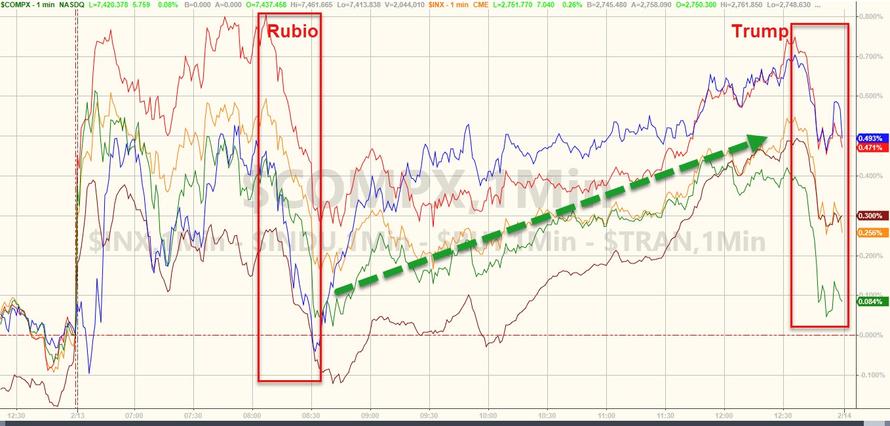
Helping matters were reports from the White House describing the talks as “detailed and intensive” and “progress between the two parties.” Even Trump’s declaration of a national emergency could not stop the computer algos’ relentless market push higher with an extra shove into the close.
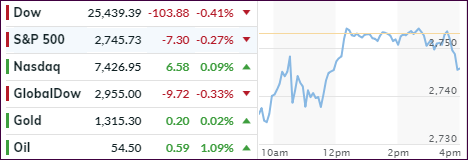
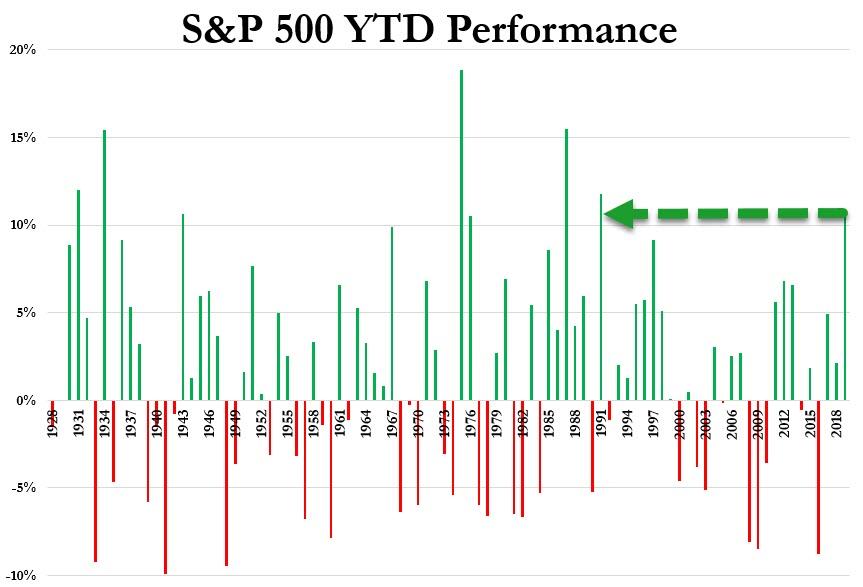
For sure, it’s been a roller coaster ride. After the S&P 500 having shown its worst quarter (Q4 2018) in many decades, it now has stormed back to notch its best start to a year since 1991.
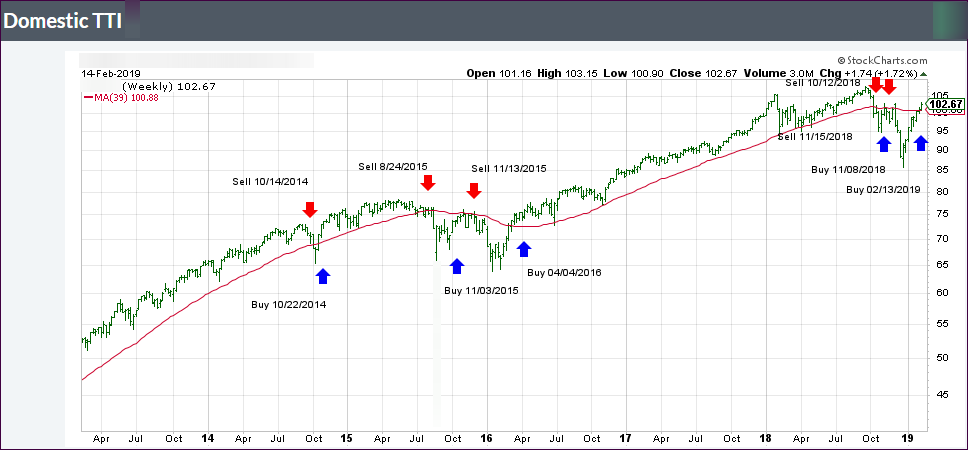
It reached this week what I call the break-even point. This simply means that, since our domestic ‘Sell’ signal on 11/15/18, it arrived at the point in time where those buy-and-hold investors made up all their losses from last quarter. So, for us trend trackers, nothing was lost, and nothing was gained.
Today’s gains propelled out International TTI above its long-term trend line and into bullish territory. Here too, I will wait a few days to see if this level holds before issuing a ‘Buy’ for that sector.