Below, please find the latest High-Volume ETF Cutline
report, which shows how far above or below their respective long-term trend
lines (39-week SMA) my currently tracked ETFs are positioned.
This report covers the HV ETF Master List from Thursday’s
StatSheet and includes 322 High Volume ETFs, defined as those with an average
daily volume of more than $5 million, of which currently 245 (last week 273)
are hovering in bullish territory. The yellow line separates those ETFs that
are positioned above their trend line (%M/A) from those that have dropped below
it.
In case you are not familiar
with some of the terminology used in the reports, please read the Glossary of Terms.
If you missed the original
post about the Cutline approach, you can read it here.
Again,
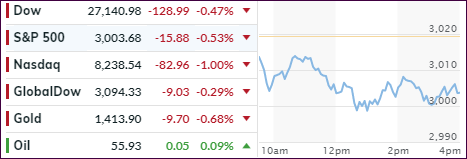
stocks opened to the downside and slid sharply lower during the early going
with the Dow sinking some 300 points at its low. The culprit was the fact that
the higher China tariffs went into effect today causing traders more anxiety,
as hope for a last-minute settlement vanished.
Things
looked pretty dicey with all major indexes ‘losing’ their 50-day M/As, while
the S&P 500 broke below the week’s
lows.
Apparently,
the powers to be did not like how this day was shaping up, so Trump stepped up
the plate by tweeting soothing comments like “talks were proceeding in a very congenial manner,” and “there was no need to rush.” This was followed
by Mnuchin muttering “constructive”
and other words designed to put some lipstick on that trade pig.
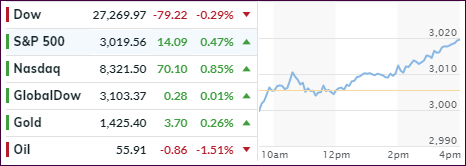
That
was sufficient to turn sentiment around, and the 4th biggest buy
program of the month, maybe it was interference by the Plunge
Protection Team, got activated and bearish momentum was replaced by an
all-out bullish
attack, which not only wiped out all the day’s losses but pushed the major indexes
to a green close.
As
ZH posted, this is the 7th Friday in a row where a sudden buy
panic lifted stocks out of trouble. Still for the week, the major indexes
ended down with the S&P giving back some 2.21%.
I am sure, we have not seen the end of this trade movie, which most likely will continue with full force next week. So far, the wild swings have not affected our positions, however, the International TTI (section 3) has moved closer to a potential ‘Sell’ signal, but we will have to wait and see if it materializes.
1. From the universe of over 1,800 ETFs, I have selected only those with a
trading volume of over $5 million per day (HV ETFs), so that liquidity and a
small bid/ask spread are assured.
2. Trend Tracking Indexes (TTIs)
Buy or Sell decisions for Domestic and International ETFs (section 1 and
2), are made based on the respective TTI and its position either above or below
its long-term M/A (Moving Average). A crossing of the trend line from below
accompanied by some staying power above constitutes a “Buy” signal. Conversely,
a clear break below the line constitutes a “Sell” signal. Additionally, I use a
7.5% trailing stop loss on all positions in these categories to control
downside risk.
3. All other investment arenas do not have a TTI and should be traded
based on the position of the individual
ETF relative to its own respective trend line (%M/A). That’s why those signals
are referred to as a “Selective Buy.” In other words, if an ETF crosses its own
trendline to the upside, a “Buy” signal is generated. Since these areas tend to
be more volatile, I recommend a wider trailing sell stop of 7.5% -10% depending
on your risk tolerance.
If you are unfamiliar with some of the terminology, please see Glossary of Termsand new subscriber information in section 9.
1. DOMESTIC EQUITY ETFs: BUY — since 02/13/2019
Click on chart to enlarge
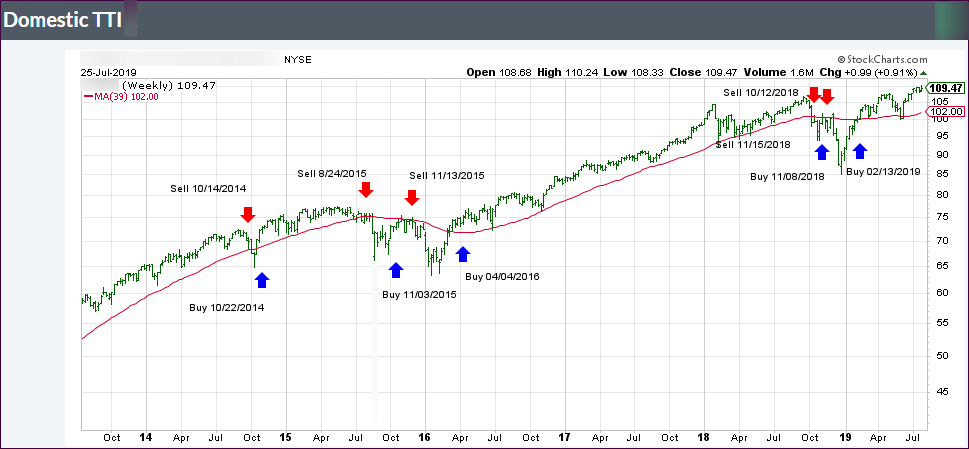
Our main directional indicator, the Domestic Trend Tracking Index (TTI-green line in the above chart) is now positioned above its long-term trend line (red) by +4.05% after having generated a new Domestic “Buy” signal effective 2/13/19 as posted.
Another
jaw dropping opening had the Dow down some 400 points early in the day, as
anxiety increased over the deepening trade dispute with China, which continued to
squash any bullish sentiment not just here in the U.S. but globally as well.
Wall
Street traders tend to operate by the well-known adage “by the rumor, sell the
fact,” but all week it has been almost impossible to figure out what is the
rumor and what is the fact in the ever worsening U.S.-China trade tug-of-war.
Today
was no exception, but to stop the markets from accelerating their plunge, Trump
came out mid-day and jawboned that “a
trade deal this week is still possible, but he has an ‘excellent alternative’ to
the China deal.”
That
pulled the markets out of their doldrums and got the rescue rebound started, causing
ZeroHedge to tweet Trump’s new strategy (tongue-in-cheek, of course):
White House new
trading strategy: deny trade deal is dead during US hours sending US stocks
higher, confirm no deal ahead of China open crashing Shanghai Composite.
Not
helping the mood of the warring trade parties was news that the FCC had barred China
Mobile from providing telecom services in the U.S. market—over espionage
concerns.
In
the end, the major indexes cut down their early losses substantially, but I must
wonder if this is just a temporary halt on the way towards a new visit in bear
market territory.
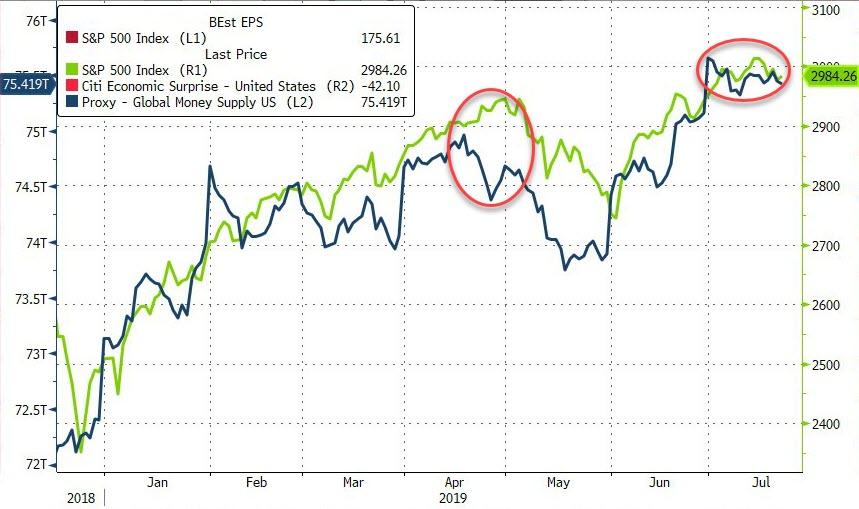
I
have on several occasions posted this
chart showing the effect global money supply (blue line) has had on the
direction of equities (S&P 500 green line).
In today’s update, the money supply has clearly rolled over begging the question “will the S&P 500 follow?”
It’s
now official. The planned tariff increases from 10% to 25% on imported Chinese
goods are scheduled to go into effect this Friday. According to Reuters, China
has made “systematic edits” to a nearly
150-page draft trade agreement by deleting commitments made previously.
That
caused the White House to lose patience with the process, as it appeared that
China’s original gesture to compromise was replaced with unwillingness to proceed.
So, all the optimistic trade rhetoric we heard over the past few months, that assisted
the markets to reach higher levels, vanished instantly as the “reneging” shifted into high gear.
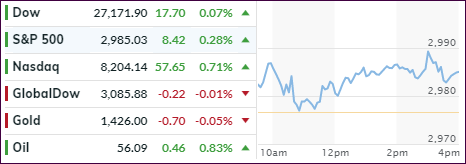
I
was surprised to see the markets to react as calmly as they did by bouncing
higher throughout the session and showing some green numbers. But, it’s
never over till it’s over.
This
became clear at the end, when a sudden sell-off brought the indexes back to their
unchanged levels, and we closed on a sour note, thereby leaving tomorrow’s market
direction wide open to speculation.
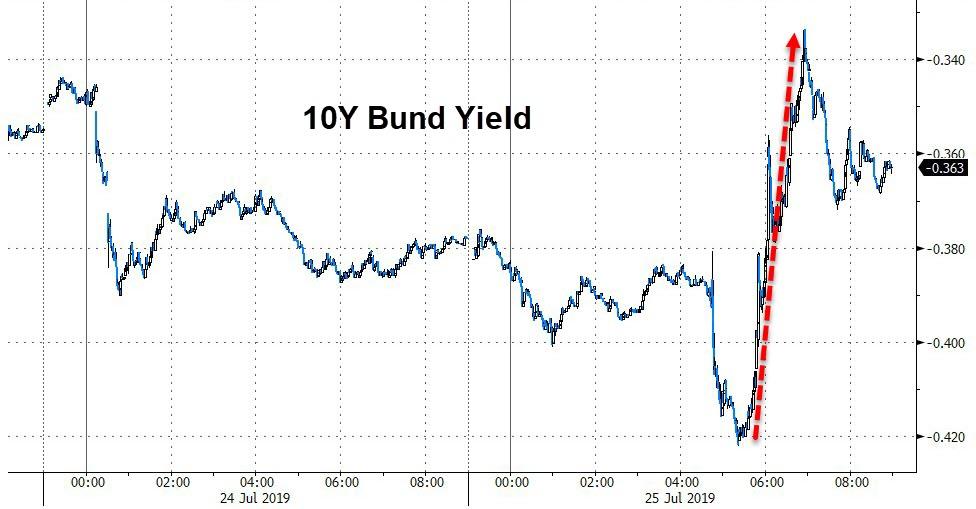
Bond
yields did an intra-day
reversal and spiked after softness early on. The 10-year closed the day 3
basis points higher at 2.49%. Right now, it looks to me that the markets are mired
in uncertainty with traders trying to figure out how to deal with the trade
dilemma.
Sure, there is always the chance that it will be resuscitated, but that may be more wishful thinking than reality, as the warring parties appear to be digging in their heels.
Volatility
returned with a vengeance, as uncertainty about the U.S.-China trade talks
ratcheted up a notch, despite Vice Premier Liu He’s intention to attend trade
talks this week in Washington.
However,
that did nothing to soothe nervous traders on Wall Street, who concluded that
no resolution would materialize by Friday, the day on which the import duties
for Chinese goods would be hiked substantially. To save the markets from further
destruction, it would not surprise me if the tariff deadline will be postponed,
say on Thursday prior to the close.
The
bears took over, and the selling accelerated throughout the session with the Dow
being down around 600 points at one time. Luckily, buyers appeared during the last
30 minutes and erased some the of the losses. However, the major indexes tumbled
in unison, with the S&P 500 improving the most during the late session rebound.
Contributing
to the sour sentiment was the EU, which slashed their growth outlook for the
region, as this
chart shows. Maybe we are finally seeing some reality creeping into the prior
hope-filled economic forecasts. After all, you can only put so much lipstick on
a pig…
Again,
it pays to look at this
graph portraying the NYSE index, the world’s largest, which is flashing a
divergence to the S&P 500. It shows that for the second time the S&P
500 has made a new all-time high, and the NYSE index did follow suit. You can see
what subsequently happened last summer when the S&P took a 20% dive.
Right
now, it looks to be an almost identical set up, which presents the question “will it be different this time?” Since
no one has that answer, we will have to wait and see how things will play out.
Despite today’s equity dump, our Trend Tracking strategy was not affected, nor did any sell stops get triggered.