Weekly StatSheet For The ETF Tracker Newsletter – Updated Through 05/23/2019

Ulli ETF StatSheet Contact

ETF Data updated through Thursday, May 23, 2019

Methodology/Use of this StatSheet:

1. From the universe of over 1,800 ETFs, I have selected only those with a trading volume of over $5 million per day (HV ETFs), so that liquidity and a small bid/ask spread are assured.

2. Trend Tracking Indexes (TTIs)

Buy or Sell decisions for Domestic and International ETFs (section 1 and 2), are made based on the respective TTI and its position either above or below its long-term M/A (Moving Average). A crossing of the trend line from below accompanied by some staying power above constitutes a “Buy” signal. Conversely, a clear break below the line constitutes a “Sell” signal. Additionally, I use a 7.5% trailing stop loss on all positions in these categories to control downside risk.

3. All other investment arenas do not have a TTI and should be traded based on  the position of the individual ETF relative to its own respective trend line (%M/A). That’s why those signals are referred to as a “Selective Buy.” In other words, if an ETF crosses its own trendline to the upside, a “Buy” signal is generated. Since these areas tend to be more volatile, I recommend a wider trailing sell stop of 7.5% -10% depending on your risk tolerance.

If you are unfamiliar with some of the terminology, please see Glossary of Terms and new subscriber information in section 9.     

1. DOMESTIC EQUITY ETFs: BUY — since 02/13/2019

Click on chart to enlarge

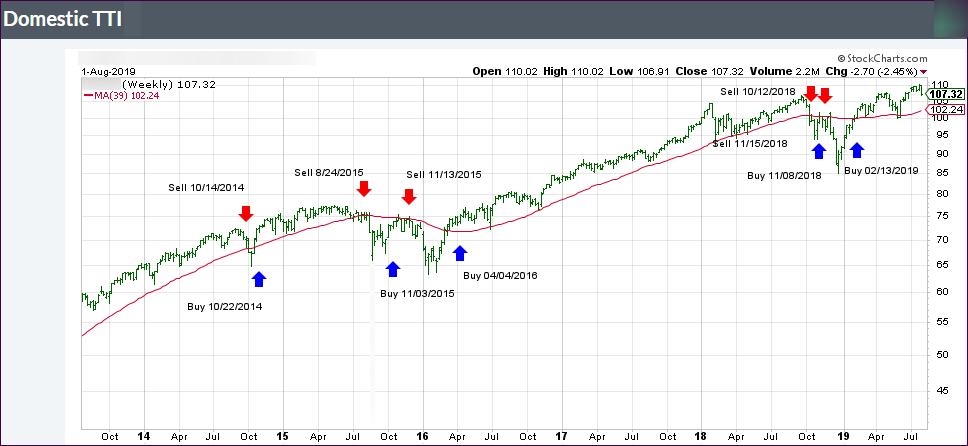
Our main directional indicator, the Domestic Trend Tracking Index (TTI-green line in the above chart) is now positioned above its long-term trend line (red) by +1.80% after having generated a new Domestic “Buy” signal effective 2/13/19 as posted.

Read More

Markets In Grieving Stage — Major Indexes Take A Hit

Ulli Market Commentary Contact

[Chart courtesy of MarketWatch.com]
  1. Moving the markets

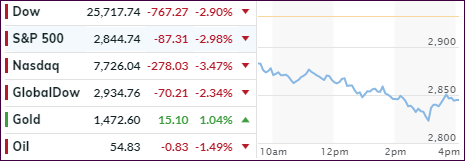
There was nothing for the computer algos to be optimistic about, as far as uplifting news headlines was concerned. There simply weren’t any, and the Dow started the session with a 400-point drop and ended up below its 200-day M/A for the first time since the beginning of the year.

Even a hint of a rebound was quickly wiped out, as traders worldwide seemed to have finally gotten the idea that the widely touted trade deal had bitten the dust, and a protracted U.S.-China confrontation has morphed into a lengthy standoff. These increased frictions weighed heavily on the markets in general and on the tech sector specifically.

The jawboning between the countries went on with China stating the talks would only continue when the U.S. adjusts its “wrong actions,” etc., etc., etc. with the tit-for-tat sinking to new lows.

None of this helped equities, which were struck be several economic data misses. New home sales collapsed in April, despite a soaring median price, even though they were expected to slide only -2.5% but instead plunged -6.9% MoM after an upward revision for March.

Business Confidence followed suit by tumbling to 7-year lows, while Crude Oil crashed to 2-month lows, likely as a result of trade tensions reducing hope for a revival of global growth.

The bond market was in panic mode, as yields plummeted with the 10-year touching 2.29%, the lowest since December 2017, as traders moved out of equities and into the perceived safety of bonds.

During the last 30 minutes of trading, some dip buyers showed up to pull the indexes off their lows, but it was not enough to affect the sea of red we witnessed all day.

Read More

Diving Into The Close

Ulli Market Commentary Contact

[Chart courtesy of MarketWatch.com]
  1. Moving the markets

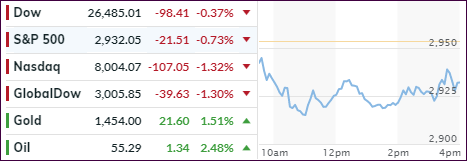
After yesterday’s strong rebound, the markets opened on a weak note with the major indexes spending the entire session below their respective unchanged lines trying to find some footing.

Not helping matters early on was a worsening of trade relations with China, which to me has now morphed into an all-out trade war, as a Chinese company has told all of its employees to boycott American products and halt international travels to the U.S. That kept the markets on a slippery footing until the Fed released its minutes on interest rates from its last meeting.

The Fed, as expected, revealed that their members are comfortable being “patient” on their current stance on interest rates, a position which could last “for some time.” While officials were split on the rate outlook over the long term, no one wanted to rock the boat “and push for a near term policy shift in either direction.”

In the end, the Fed’s announcement was not enough to keep the bears in check, and, after a mid-day rally, we dove into the close with selling picking up due to the White House ramping up its trade war rhetoric.

Where do we go from here? While our Trend Tracking Indexes (TTIs) continue to support the bullish theme, there are two indicators, which are flashing warning signs. The first one, thanks to Bloomberg, is a Boom-Bust indicator charted against the S&P 500, while the second one is the Global Money Supply Index.

Both are forecasting a potential decline in stocks, however, as always, the timing of it is the big unknown. For that, we will rely on our Trend Tracking Indexes (TTIs) to point the way towards the exit doors, once the need arises.

Read More

Walking Back The Tough Talk — Markets Stage Comeback

Ulli Market Commentary Contact

[Chart courtesy of MarketWatch.com]
  1. Moving the markets

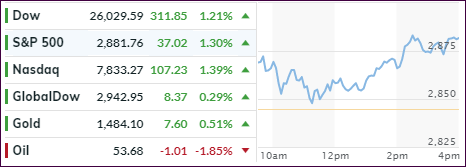
The White House walked back some of its tough talk last night by announcing that they are offering some temporary exceptions to export limitations against China’s Huawei Technologies. While the mudslinging continued, it was enough of a conciliatory gesture to soothe the anxiety among Wall Street traders, which had been focusing on pressing the sell buttons all day yesterday.

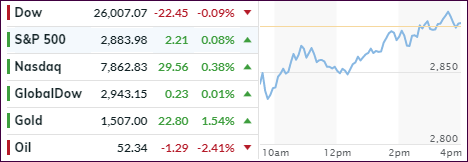
Dip buyers emerged and drove the major indexes to some solid gains, with especially the Nasdaq recouping some of yesterday’s sharp losses. Support also came from a short squeeze in SmallCaps, as this chart shows.

The fallout from yesterday’s threat by the Chinese to curtail the export of rare-earth minerals was immediate, as China’s rare earth holdings catapulted some 132% in a market that does not have upside/downside price limits.

On the domestic front, the news was not good, as existing home sales tumbled YoY for the 14th month. Expectations had called for a +2.7% rise in April, which was not even close, as reality showed a decline of -0.4%, which comes after a shocking -4.9% drop in March. At least for today, this “bad” news was good news, as the bullish market theme was not even interrupted to let this realism set in.

Let’s see if this comeback has legs, or if it is simply a “one-off” in a market that is predominantly headline driven.

Read More

Trade Tensions Heat Up — Markets Head Down

Ulli Market Commentary Contact

[Chart courtesy of MarketWatch.com]
  1. Moving the markets

The trade war rhetoric between the U.S. and China heated up over the weekend, with both sides threatening a variety of consequences. The major indexes headed south with the Nasdaq taking the brunt of the losses.

Chipmakers took it on the chin, as U.S. tech companies, in compliance with White House requests, have begun to implement the ban on Huawei Technology products. The company will be cut off from receiving Android updates and will be restricted to use only public open-source versions of the software program.

AAPL stock fell after warnings of retaliatory action from China, which plays a big role in how Chinese consumers perceive U.S. products, and “acceleration” to adopt local iPhone substitutes could be damaging to say the least.

To further put the heat on the U.S., China’s Xi threatened to use one of their nuclear options, namely banning Rare-Earth mineral exports, which for sure would cripple supply chains of these rare commodities necessary in all tech products and military applications.

In other words, the tit-for-tat continues with no end in sight, and it appears that trade differences are about to morph into an all-out trade war. That will not be a positive for equity markets, unless the bizarre theme of the past that “bad news is good news” still makes its presents felt.

Read More

ETFs On The Cutline – Updated Through 05/17/2019

Ulli ETFs on the Cutline Contact

Below, please find the latest High-Volume ETF Cutline report, which shows how far above or below their respective long-term trend lines (39-week SMA) my currently tracked ETFs are positioned.

This report covers the HV ETF Master List from Thursday’s StatSheet and includes 322 High Volume ETFs, defined as those with an average daily volume of more than $5 million, of which currently 221 (last week 245) are hovering in bullish territory. The yellow line separates those ETFs that are positioned above their trend line (%M/A) from those that have dropped below it.

Take a look:                                                                   

The HV ETF Master Cutline Report

In case you are not familiar with some of the terminology used in the reports, please read the Glossary of Terms. If you missed the original post about the Cutline approach, you can read it here.