
- Moving the markets
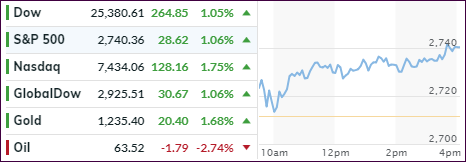
Continued hope for a trade resolution with China provided the assist the markets needed to score another winning session, it’s first 3-day win streak in six weeks. Also hope that Apples’ afterhours earnings report would be a blow-out event contributed to the upward thrust.
The overall positive tone from the US and China regarding their trade negotiations unleashed several things at once. First, the Chinese Yuan jumped sharply and second, we saw the biggest short squeeze since June 2016. While this effect was momentarily bullish, one look at this chart shows what happened last time after such an euphoric event.
The 1st fall guy was the US Dollar, which moved opposite of the surging Yuan and registered its biggest single-day drop since March, which gave gold a boost to the upside while breaking above its 100-day M/A. The 2nd fall guy was crude oil, which was hammered to the $63 level and homing in on bear market territory (-18% from the recent highs).
Today’s upbeat tone in the equity arena helped improve the positions of our Trend Tracking Indexes (see section 3), which are now heading towards a trend line break to the upside, but we are not there yet. However, another upswing along today’s magnitude may bring a new “Buy” signal into play—at least for the domestic arena.
- ETFs in the Spotlight
In case you missed the announcement and description of this section, you can read it here again.
It features 10 broadly diversified and sector ETFs from my HighVolume list as posted every Saturday. Furthermore, they are screened for the lowest MaxDD% number meaning they have been showing better resistance to temporary sell offs than all others over the past year.
The below table simply demonstrates the magnitude with which some of the ETFs are fluctuating regarding their positions above or below their respective individual trend lines (%M/A). A break below, represented by a negative number, shows weakness, while a break above, represented by a positive percentage, shows strength.
For hundreds of ETF choices, be sure to reference Thursday’s StatSheet.
Year to date, here’s how our candidates have fared so far:
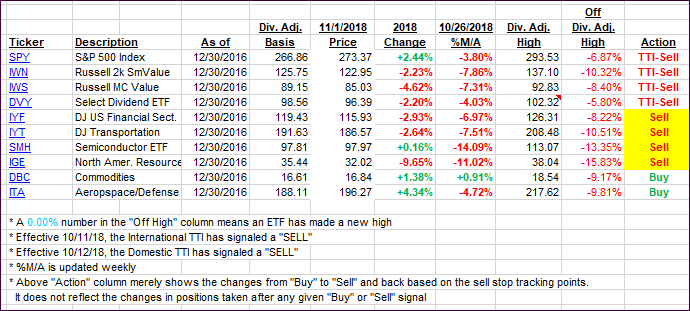
Again, the %M/A column above shows the position of the various ETFs in relation to their respective long-term trend lines, while the trailing sell stops are being tracked in the “Off High” column. The “Action” column will signal a “Sell” once the -8% point has been taken out in the “Off High” column. For more volatile sector ETFs, the trigger point is -10%.
- Trend Tracking Indexes (TTIs)
Our Trend Tracking Indexes (TTIs) rallied towards their respective trend lines with especially the Domestic one on its way towards a trend line break.
Here’s how we closed 11/01/2018:
Domestic TTI: -1.51% below its M/A (last close -2.92%)—Sell signal effective 10/12/2018
International TTI: -4.28% below its M/A (last close -5.32%)—Sell signal effective 10/11/2018
Disclosure: I am obliged to inform you that I, as well as my advisory clients, own some of the ETFs listed in the above table. Furthermore, they do not represent a specific investment recommendation for you, they merely show which ETFs from the universe I track are falling within the guidelines specified.
Contact Ulli