
- Moving the markets
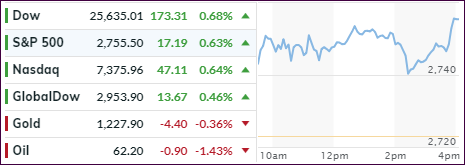
With most of the mid-term election results being on deck later tonight, it came as no surprise that the markets meandered, but with a bullish bias, as all 3 major indexes closed in the green with last minute buying helping the bullish cause, although on ultra-low volume (60% below average).
Polls and forecasts occupied the headlines where opinions varied widely ranging from “what happened to equities after every midterm” to “a healthy 30%-plus correction headed for stocks.” Of course, someone is bound to be dead wrong when you consider totally opposing views.
One investment firm summed the current scenario up this way:
“It is definitely not the time to buy the dip,” said London & Capital’s CIO Pau Morilla-Giner. “Everything that could go well for U.S. consumers in the last couple of years has gone well, but now the tide is turning… At the moment, you are running out of drivers of growth in the U.S.”
I agree with this assessment but will add that momentum can turn quickly even in the face of slowing fundamentals. There could be a relief rally in store, so we need to be prepared to jump back in should our Domestic TTI (section 3) crosses back above its long-term trend line. As of today, we are only -0.41% away from a new “Buy” Signal.
On the other hand, the Fed will make his announcement regarding interest rates tomorrow around noon which, depending on the outcome, could wreak havoc with the markets. It promises to be an interesting next few days.
- ETFs in the Spotlight
In case you missed the announcement and description of this section, you can read it here again.
It features 10 broadly diversified and sector ETFs from my HighVolume list as posted every Saturday. Furthermore, they are screened for the lowest MaxDD% number meaning they have been showing better resistance to temporary sell offs than all others over the past year.
The below table simply demonstrates the magnitude with which some of the ETFs are fluctuating regarding their positions above or below their respective individual trend lines (%M/A). A break below, represented by a negative number, shows weakness, while a break above, represented by a positive percentage, shows strength.
For hundreds of ETF choices, be sure to reference Thursday’s StatSheet.
Year to date, here’s how our candidates have fared so far:
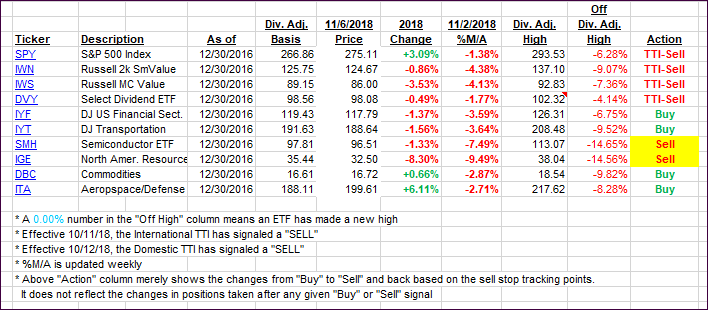
Again, the %M/A column above shows the position of the various ETFs in relation to their respective long-term trend lines, while the trailing sell stops are being tracked in the “Off High” column. The “Action” column will signal a “Sell” once the -8% point has been taken out in the “Off High” column. For more volatile sector ETFs, the trigger point is -10%.
- Trend Tracking Indexes (TTIs)
Our Trend Tracking Indexes (TTIs) improved again with the Domestic one now being in spitting distance of crawling back above its long-term trend line and into bullish territory.
Here’s how we closed 11/06/2018:
Domestic TTI: -0.41% below its M/A (last close -1.10%)—Sell signal effective 10/12/2018
International TTI: -3.11% below its M/A (last close -3.54%)—Sell signal effective 10/11/2018
Disclosure: I am obliged to inform you that I, as well as my advisory clients, own some of the ETFs listed in the above table. Furthermore, they do not represent a specific investment recommendation for you, they merely show which ETFs from the universe I track are falling within the guidelines specified.
Contact Ulli