
- Moving the markets
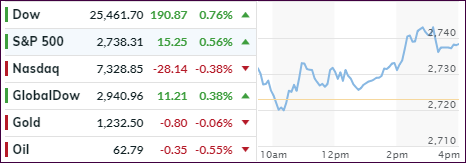
In view of tomorrow’s mid-term elections, the markets meandered with a slight upward bias in hopes that Tuesday’s outcome will not shift the balance of power, which could be key in terms of future market direction.
Two of the three major indexes gained moderately on news that a Rasmussen poll showed hopeful signs for the GOP. Of course, poll results can vary wildly and are better disregarded until the final count is completed. The Nasdaq was the laggard, as Apple still proved to be the anchor after announcing that they no longer have plans to disclose unit sales for some of their key products.
On Wednesday, we will find out if the Fed will hike rates again, which could spark a whirlwind on Wall Street. Should the GOP, which traders consider market positive, come out ahead, a rally may ensue, which, however, could be ruined by the Fed announcing an interest rate increase.
If they don’t, we may see the markets take off and, depending on the magnitude, we may see our Domestic Trend Tracking Index (TTI) break back above its long-term trend line into bullish territory, thereby signaling a new “Buy.”
Right now, we must be patient and see how things play out.
- ETFs in the Spotlight
In case you missed the announcement and description of this section, you can read it here again.
It features 10 broadly diversified and sector ETFs from my HighVolume list as posted every Saturday. Furthermore, they are screened for the lowest MaxDD% number meaning they have been showing better resistance to temporary sell offs than all others over the past year.
The below table simply demonstrates the magnitude with which some of the ETFs are fluctuating regarding their positions above or below their respective individual trend lines (%M/A). A break below, represented by a negative number, shows weakness, while a break above, represented by a positive percentage, shows strength.
For hundreds of ETF choices, be sure to reference Thursday’s StatSheet.
Year to date, here’s how our candidates have fared so far:
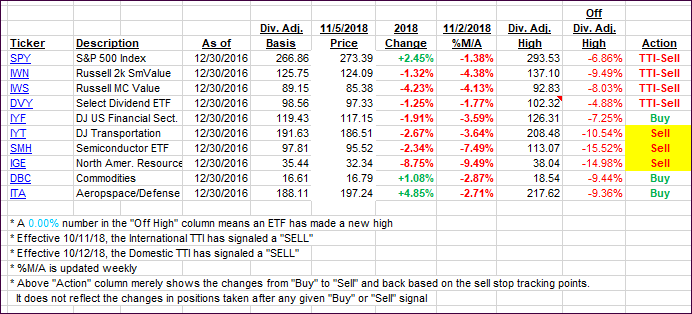
Again, the %M/A column above shows the position of the various ETFs in relation to their respective long-term trend lines, while the trailing sell stops are being tracked in the “Off High” column. The “Action” column will signal a “Sell” once the -8% point has been taken out in the “Off High” column. For more volatile sector ETFs, the trigger point is -10%.
- Trend Tracking Indexes (TTIs)
Our Trend Tracking Indexes (TTIs) improved with especially the Domestic one homing in on a potential trend line break to the upside.
Here’s how we closed 11/05/2018:
Domestic TTI: -1.10% below its M/A (last close -1.83%)—Sell signal effective 10/12/2018
International TTI: -3.54% below its M/A (last close -3.88%)—Sell signal effective 10/11/2018
Disclosure: I am obliged to inform you that I, as well as my advisory clients, own some of the ETFs listed in the above table. Furthermore, they do not represent a specific investment recommendation for you, they merely show which ETFs from the universe I track are falling within the guidelines specified.
Contact Ulli