Below, please find the latest High-Volume ETF Cutline
report, which shows how far above or below their respective long-term trend
lines (39-week SMA) my currently tracked ETFs are positioned.
This report covers the HV ETF Master List from Thursday’s
StatSheet and includes 322 High Volume ETFs, defined as those with an average
daily volume of more than $5 million, of which currently 157 (last week 199)
are hovering in bullish territory. The yellow line separates those ETFs that
are positioned above their trend line (%M/A) from those that have dropped below
it.
In case you are not familiar
with some of the terminology used in the reports, please read the Glossary of Terms.
If you missed the original
post about the Cutline approach, you can read it here.
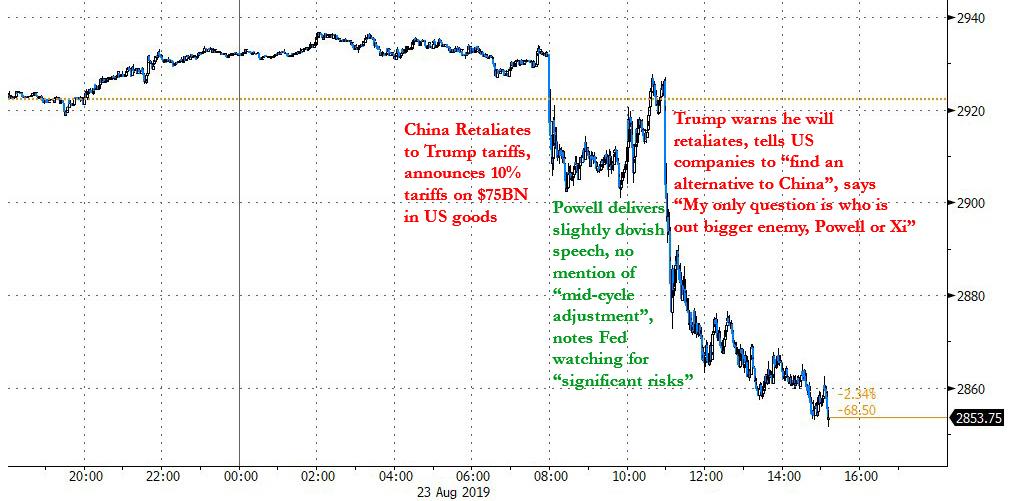
To be fair, it wasn’t just Fed chief Powell’s
Jackson Hole speech that put the markets in a sour mood. The hammer came down hard,
after Trump unleashed a verbal tirade, first towards the Fed:
As usual, the Fed did NOTHING! It is
incredible that they can “speak” without knowing or asking what I am doing,
which will be announced shortly. We have a very strong dollar and a very weak
Fed. I will work “brilliantly” with both, and the U.S. will do great. My only
question is, who is our bigger enemy, Jay Powel or Chairman Xi?”
If that was not enough, he upped
the ante in response to China’s threat to levy new tariffs on the US:
“We don’t need China and, frankly, would
be far better off without them“, and ordered “Our great
American companies… to immediately start looking for an alternative to China,
including bringing your companies HOME and making your products in the
USA.”
“I will be responding to China’s Tariffs this
afternoon.”
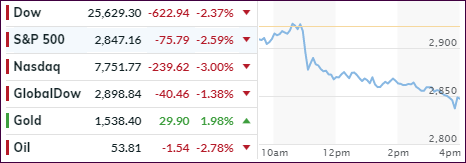
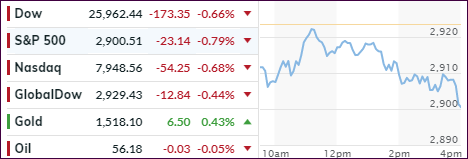
Not much else was needed to shift the
computer algos and traders into selling mode and down we went. There was no looking
back with all major indexes closing deeply in the red, and that reaction did not
even include Trump’s mystery “afternoon” announcement.
The war of words can’t get much uglier, and
we may see more fallout next week when the rhetoric is sure to continue. In the
meantime, the G-7 meeting is on deck for this weekend in France. Last time, the
get-together was such a disaster that the seven nations could not even agree on
a common communique. I don’t expect much more this time.
This week’s wild swings in the market have left
their mark on our Trend Tracking Indexes (TTIs). As posted, the International
one headed into bear market territory on 8/15/19, while the Domestic one bounced
off its trend line and has held steady until today.
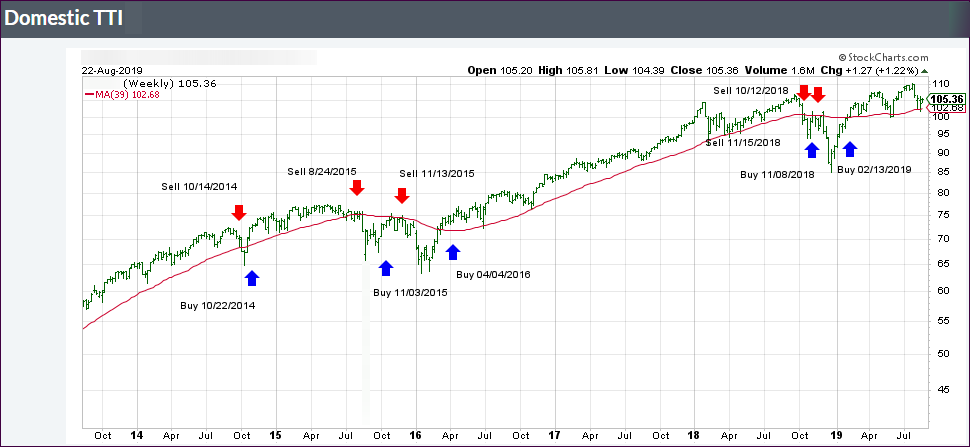
The Domestic TTI has now slipped slightly
below its long-term trend line (see section 3) and may very well signal a move to
the sidelines next week. We are also approaching the notoriously volatile month
of the September, where anything is possible.
ETF Data
updated through Thursday, August 22, 2019
Methodology/Use of this StatSheet:
1. From the universe of over 1,800 ETFs, I have selected only those with a
trading volume of over $5 million per day (HV ETFs), so that liquidity and a
small bid/ask spread are assured.
2. Trend Tracking Indexes (TTIs)
Buy or Sell decisions for Domestic and International ETFs (section 1 and
2), are made based on the respective TTI and its position either above or below
its long-term M/A (Moving Average). A crossing of the trend line from below
accompanied by some staying power above constitutes a “Buy” signal. Conversely,
a clear break below the line constitutes a “Sell” signal. Additionally, I use a
7.5% trailing stop loss on all positions in these categories to control
downside risk.
3. All other investment arenas do not have a TTI and should be traded
based on the position of the individual
ETF relative to its own respective trend line (%M/A). That’s why those signals
are referred to as a “Selective Buy.” In other words, if an ETF crosses its own
trendline to the upside, a “Buy” signal is generated. Since these areas tend to
be more volatile, I recommend a wider trailing sell stop of 7.5% -10% depending
on your risk tolerance.
If you are unfamiliar with some of the terminology, please see Glossary of Termsand new subscriber information in section 9.
1. DOMESTIC EQUITY ETFs: BUY
— since 02/13/2019
Click on chart to enlarge
Our main directional indicator, the Domestic Trend Tracking Index (TTI-green line in the above chart) is now positioned above its long-term trend line (red) by +2.83% after having generated a new Domestic “Buy” signal effective 2/13/19 as posted.
An early rally fizzled, as
uncertainty over the outlook of interest rates kept traders on edge, especially
due to the upcoming Fed statement regarding the Jackson Hole meetings. I think
Fed head Powell’s position on rates is well known, and his upcoming speech on
Friday is likely to disappoint those hoping for more dovishness.
Not helping the markets was
an announcement by the German Bundesbank proclaiming that “they don’t see a
need right now for fiscal stimulus at this time, even though they expect the
economy to shrink again this quarter.”
That was totally opposite of
what was expected, and markets started to sag. Then another hawkish nightmare
appeared out of nowhere when the Fed’s Patrick Harker opined in an interview
that “he doesn’t see any need for further stimulus at the moment.”
Some of his soundbites included:
“Yield
curve is only one of many signals.”
“Trade
issue makes business decisions difficult.”
“Growth
now is exactly what we had anticipated last year.”
“No
need for another rate cut, central bank should stay here for a while.”
“Trade
resolution would boost growth.”
Ouch. That was not exactly
what traders had hoped for, so the markets continued riding the range but
managed to eradicate some of the early session losses.
Nevertheless, Fed chair
Powell is set to deliver a speech tomorrow, during which investors will be eagerly
looking for clues as to whether another rate cut will be on deck for September.
Good earnings by consumer
heavyweights Target, Lowe’s and Home Depot set the bullish mood early on and pushed
equities up to a level that they sustained throughout the session. All of yesterday’s
losses were wiped out with the S&P 500 closing exactly at Monday’s price.
The Fed minutes did not
offer any earthshaking news other than to confirm that the July rate cut was simply
insurance for growth and inflation and considered to be a mid-cycle adjustment.
It’s supposed to help counter the effects of weak global growth and trade
uncertainty.
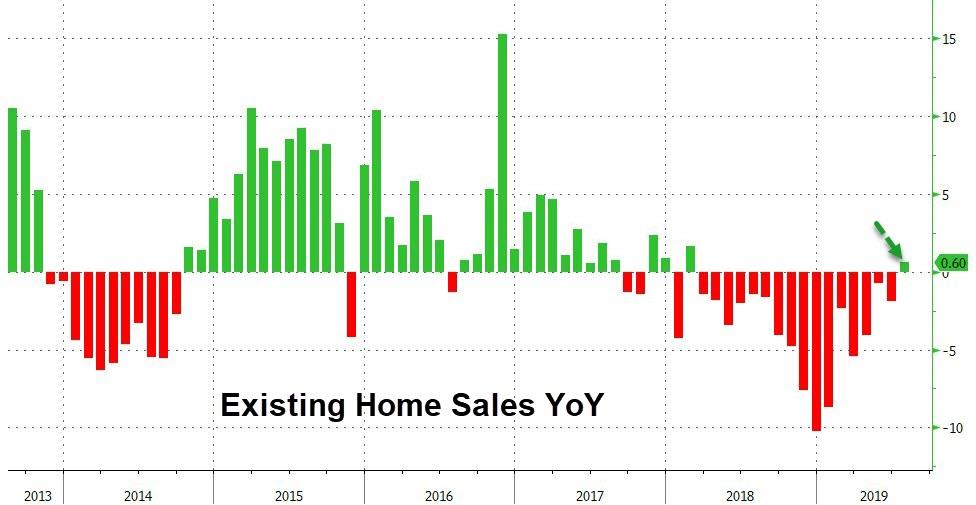
Good economic news came from
housing sector, as we learned that Existing Home Sales rose YoY
and thereby breaking a 16-month losing streak. They came in at +0.6%, while the
median sales price also advanced by 4.3% from a year earlier.
Offsetting this good news
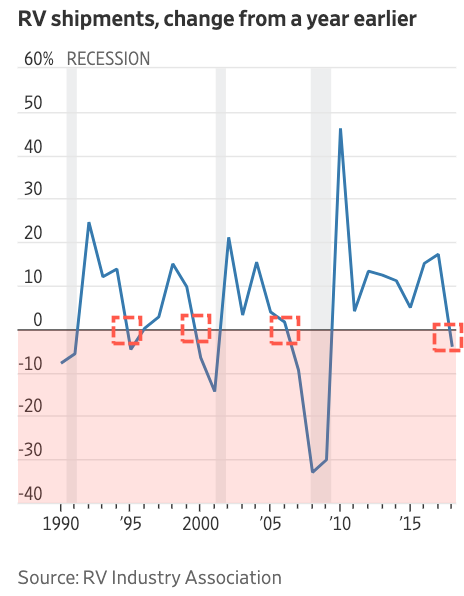
were reports that the RV industry crashed with domestic shipments
to dealers plummeting 20% so far this year, after dropping only 4% for the entire
year of 2018. Ouch.
On the global scene, Germany
attempted to sell the world’s first 30-year negative yielding bond (-0.11%), which
failed miserably. When the dust settled, it turned out that only 824 million
Euro of the total 2 billion Euro offering were sold with the Bundesbank now
being forced to retain the unsold portion. That’s a big ouch. After all,
government bonds need to be sold to cover the ever-growing deficits.
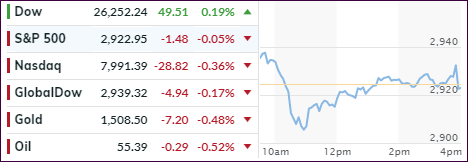
For the week, we saw that Monday
was up, Tuesday was down, and Wednesday was up. This rollercoaster may very
well continue until the bankers’ Jackson Hole meeting ends on Friday, or the weekend
G-7 meeting results, or lack thereof, make their presence felt on Monday.
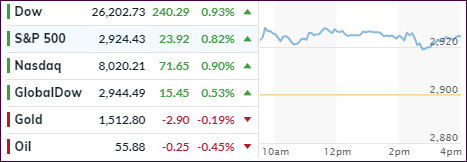
Numerous attempts by the major
indexes to break above their respective unchanged lines were rebuffed, as they
ended up diving into the close and breaking a 3-day win streak.
Despite Home Depot’s better than
expected quarterly results, the markets struggled for altitude all day with
worries about the strength of the US economy, along with political developments
in Europe (Italy’s prime minister resigned), weighing on government bonds.
The US 10-year yield slipped
again by 6 basis points to 1.55%. In the meantime, Trump continued his assault
on the Fed by asking to consider deeper cuts, something like 1%. This contradicts
the widely advertised view that we have the “best economy ever.” Well,
if we did, interest rates would be rising and not declining, as they have been.
After the 3-day rally,
uncertainty affected the mood on Wall Street, as Friday’s speech by Fed head
Powell looms large, and you can be sure that every word will be dissected when
the bankers’ conference in Jackson Hole ends.
For hints of things to come,
traders will be busy analyzing the minutes from the Fed’s July policy meeting,
which will be released tomorrow. I expect a wait-and-see attitude to keep the
indexes in check till Friday.