
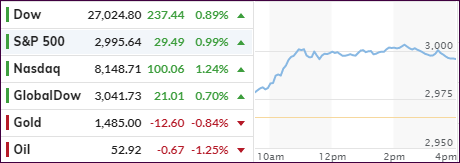
- Moving the markets
After the “mini trade” deal faded yesterday, today’s news brought into question whether anything was accomplished. Chinese officials essentially confirmed that the progress on the “phase 1” deal may have been a sham.
Beijing will make good on the $50 billion of annual agricultural purchases, but only if Washington agrees to remove all the trade war tariffs. On the other hand, Trump has made it clear that the tariffs must remain in place until a deal has been implemented with the Chinese proving that they are abiding by the rules.
While the futures markets slumped on the news, this was quickly forgotten as the computer algos jumped on the earnings bandwagon with traders cheering a bunch of ‘not really’ upbeat corporate earnings reports thereby pushing the “phase 1” trade deal on the back burner. Also throwing in a temporary assist to the bulls were news of an alleged breakthrough of the always changing Brexit negotiations.
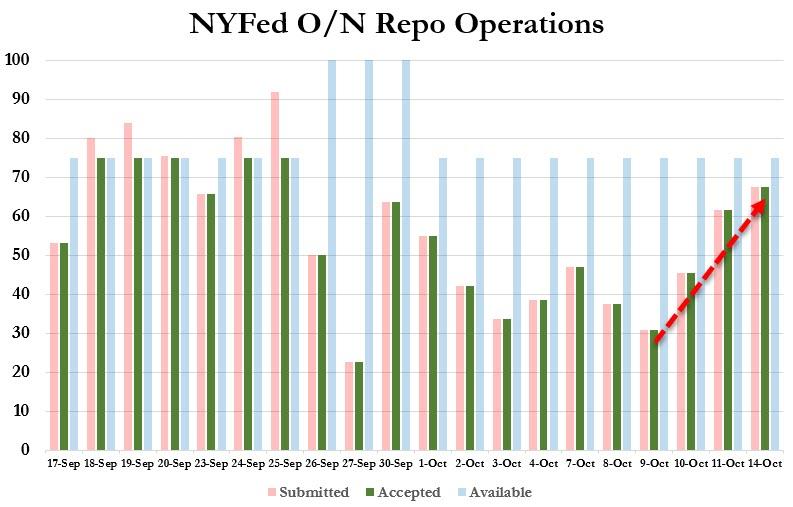
In the meantime, the Fed’s overnight Repo operations to provide liquidity to banks surged to nearly $90 billion, which means the initial problem I posted about is anything but transitory and will eventually affect stock markets. The question in my mind is not “if” but “when.”
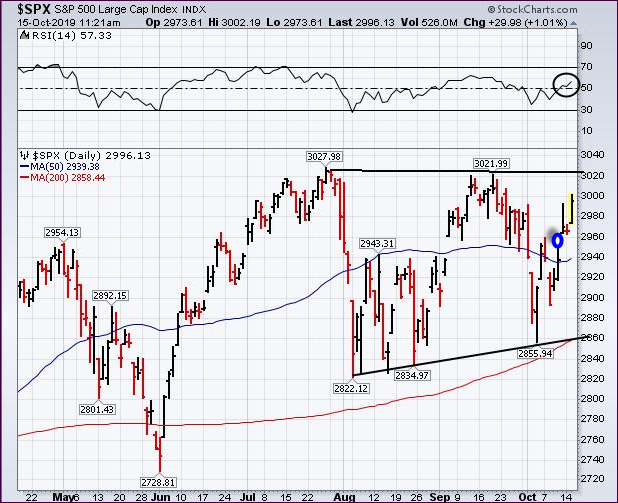
Despite best efforts, the S&P 500 fell short of reclaiming its psychologically important 3,000 level. It may break through it, but it will then face stiff overhead resistance at the high end of the trading range at around 3,022. If we get there, the index may very well turn around again to close its October break-away gap (blue) before possibly starting another rally attempt.
ZH summed up the rally-on-no-news like this:
China (negatively) snubbed Trump’s trade deal overnight, demanding tariffs removed before Ag buy.
China (negatively) saw CPI surge, somewhat reducing option of brad-based stimulus
Brexit (positively) was reported as being closer to becoming a deal.
Fed Repo bailout (negatively) surged to its highest since September.
Tariffs (positively) did not get implemented today (which is, of course, old news).
Earnings (negatively) signaled ugliness persists for GS and WFC.
Earnings (positively) beat (with UNH, JPM and JNJ helping support The Dow).
IMF (negatively) downgraded global growth to weakest since Lehman.
2. ETFs in the Spotlight
In case you missed the announcement and description of this section, you can read it here again.
It features 10 broadly diversified and sector ETFs from my HighVolume list as posted every Saturday. Furthermore, they are screened for the lowest MaxDD% number meaning they have been showing better resistance to temporary sell offs than all others over the past year.
The below table simply demonstrates the magnitude with which some of the ETFs are fluctuating regarding their positions above or below their respective individual trend lines (%+/-M/A). A break below, represented by a negative number, shows weakness, while a break above, represented by a positive percentage, shows strength.
For hundreds of ETF choices, be sure to reference Thursday’s StatSheet.
For this current domestic “Buy” cycle, here’s how some our candidates have fared:
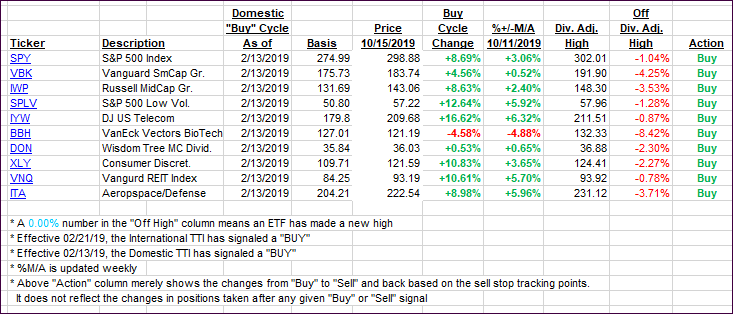
Again, the %+/-M/A column above shows the position of the various ETFs in relation to their respective long-term trend lines, while the trailing sell stops are being tracked in the “Off High” column. The “Action” column will signal a “Sell” once the -8% point has been taken out in the “Off High” column. For more volatile sector ETFs, the trigger point is -10%.
3. Trend Tracking Indexes (TTIs)
Our Trend Tracking Indexes (TTIs) recovered and gained, as the indexes rallied on basically no news other than the start of earnings season.
Here’s how we closed 10/15/2019:
Domestic TTI: +2.95% above its M/A (prior close +2.10%)—Buy signal effective 02/13/2019
International TTI: +1.10% above its M/A (prior close +0.16%)—Sell signal effective 10/03/2019
Disclosure: I am obliged to inform you that I, as well as my advisory clients, own some of the ETFs listed in the above table. Furthermore, they do not represent a specific investment recommendation for you, they merely show which ETFs from the universe I track are falling within the specified guidelines.
Contact Ulli