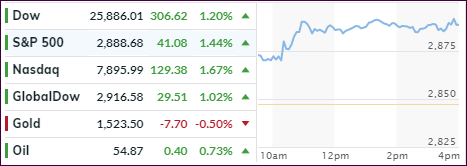
Friday’s rebound did not die
today but continued full force thanks to Trump’s successful jawboning about the
trade talks. It was more of a concession towards the Chinese telecom giant Huawei,
which received a 90-day reprieve, during which it can continue to do business
with American companies without needing a case-by-case license.
Reports that Germany may be considering
stimulus measures, to pull up their sagging economy, helped the global mood and
supported equities for that region. Again, fiscal recklessness is always a positive
for equities.
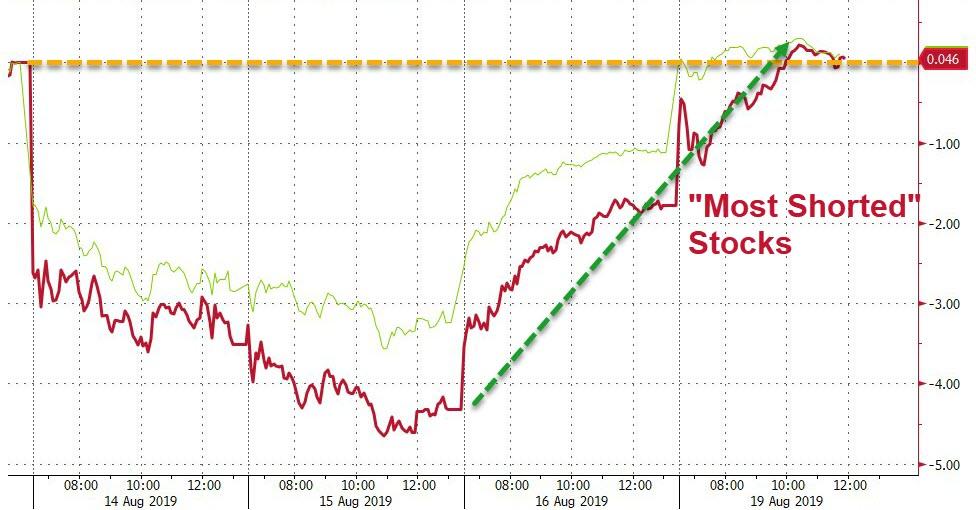
Another big assist came from
a giant short
squeeze, the biggest in 7 months, which started on Friday and kept bulls happy
for the past 2 trading days, as all of last week’s losses have now been
recovered.
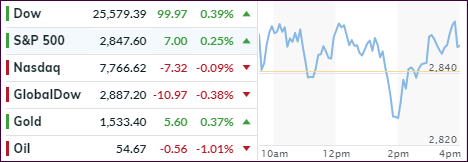
In the end, despite slightly
rising bond yields, the mission was accomplished, and the S&P 500 is now
less than 2% away from going green for the month.
Below, please find the latest High-Volume ETF Cutline
report, which shows how far above or below their respective long-term trend
lines (39-week SMA) my currently tracked ETFs are positioned.
This report covers the HV ETF Master List from Thursday’s
StatSheet and includes 322 High Volume ETFs, defined as those with an average
daily volume of more than $5 million, of which currently 199 (last week 206)
are hovering in bullish territory. The yellow line separates those ETFs that
are positioned above their trend line (%M/A) from those that have dropped below
it.
In case you are not familiar
with some of the terminology used in the reports, please read the Glossary of Terms.
If you missed the original
post about the Cutline approach, you can read it here.
After yesterday’s lackluster session to nowhere,
the markets found some upside momentum, with the ensuing relief rally reducing
some of the losses sustained on Wednesday.
Trying to calm matters was St. Louis Fed
President Bullard’s remarks that inter-meeting action would not be necessary,
referring to the fact that there is no Fed meeting in August, and that a couple
of weeks one way or the other won’t matter.
Then this gag order hit the wires: Fed Chair Powell
has banned any public appearances by any Fed Board member, noting that “appearances
at conferences have been canceled, all scheduled interviews have been abandoned
and any comments on or off the record are outlawed.”
One analyst interpreted this unprecedented
action as a reflection of two pressures:
First, economic indicators increasingly
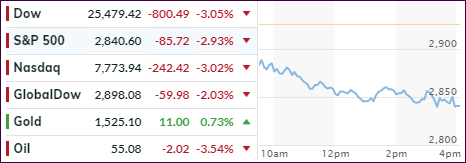
suggest the US is heading into a recession with the Dow plunging 800 points on
Wednesday.
Second, relations with the White House have
reached a new low, with president Trump pinning the success of his presidency
upon a strong economy as a recession – Trump believes – would destroy his
reputation and kill his reelection chances. As a result, Trump has – correctly
– blamed the current woeful state of the global economy on the Fed. The problem
is that Trump also “owned” the same state of both the economy and the
market for the past two years, so any recession will be entirely his, just as Yellen
(and Bernanke) intended, and shift attention away from the Fed.
On the economic side, data was dire, maybe
that’s why markets rallied, as Consumer Confidence crashed in August to 92.1
from 98.4 missing all forecasts as per Bloomberg’s survey of economists. Then Housing
Starts plunged by a whopping 4.0% MoM and missing expectations for a 0.2% rise.
And that despite tumbling interest rates and rising mortgage applications
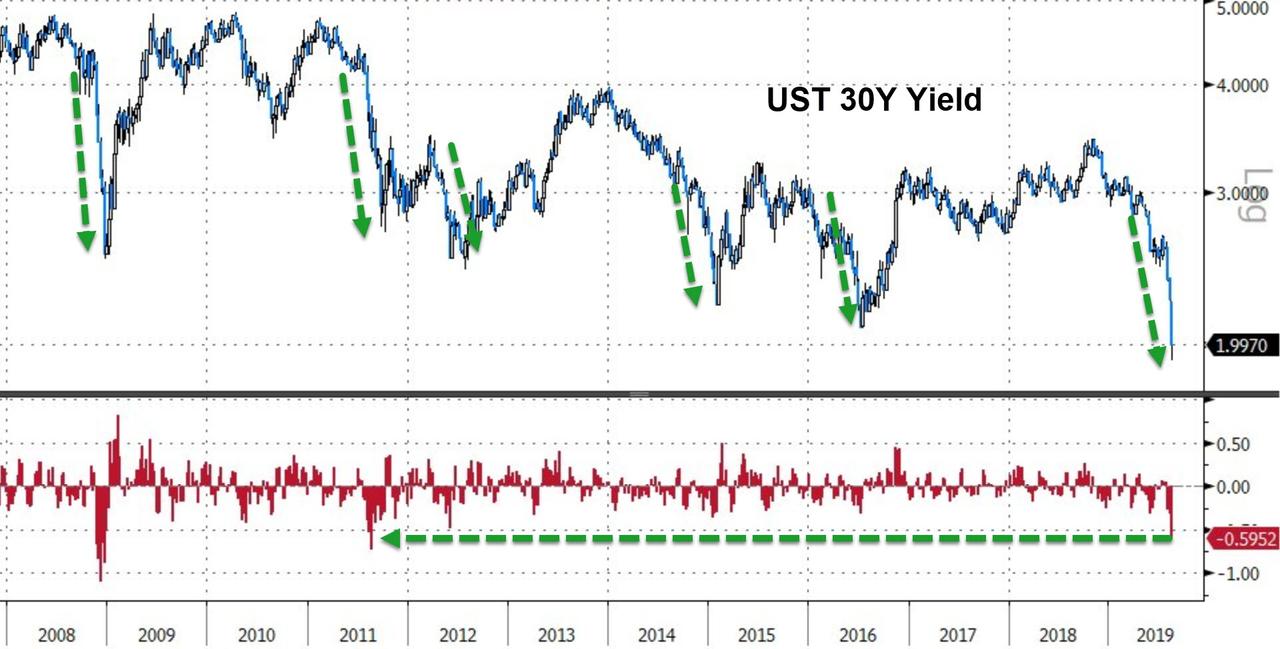
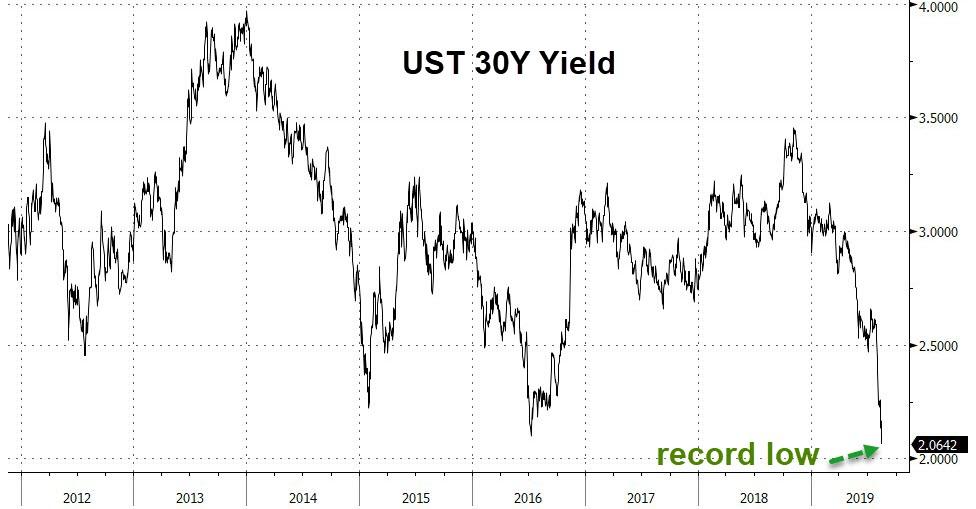
But the story of the week was bond yields, with
the 30-year seeing its biggest crash since August 2011, as it fell to a record
low and crossed the 2% level to the downside. As I posted before, the race
to the bottom is on, and lower rates appear to be on the menu, with now $17
trillion of global bonds being negative. It’s only a matter of time until we
get there as well.
That is, unless a Black Swan event suddenly reverses
that trend and catapults yields considerably higher. It looks to me that volatility
and uncertainty will be with us in the foreseeable future.
ETF Data updated through Thursday, August 15, 2019
Methodology/Use of this StatSheet:
1. From the universe of over 1,800 ETFs, I have selected only those with a
trading volume of over $5 million per day (HV ETFs), so that liquidity and a
small bid/ask spread are assured.
2. Trend Tracking Indexes (TTIs)
Buy or Sell decisions for Domestic and International ETFs (section 1 and
2), are made based on the respective TTI and its position either above or below
its long-term M/A (Moving Average). A crossing of the trend line from below
accompanied by some staying power above constitutes a “Buy” signal. Conversely,
a clear break below the line constitutes a “Sell” signal. Additionally, I use a
7.5% trailing stop loss on all positions in these categories to control
downside risk.
3. All other investment arenas do not have a TTI and should be traded
based on the position of the individual
ETF relative to its own respective trend line (%M/A). That’s why those signals
are referred to as a “Selective Buy.” In other words, if an ETF crosses its own
trendline to the upside, a “Buy” signal is generated. Since these areas tend to
be more volatile, I recommend a wider trailing sell stop of 7.5% -10% depending
on your risk tolerance.
If you are unfamiliar with some of the terminology, please see Glossary of Termsand new subscriber information in section 9.
1. DOMESTIC EQUITY ETFs: BUY
— since 02/13/2019
Click on chart to enlarge
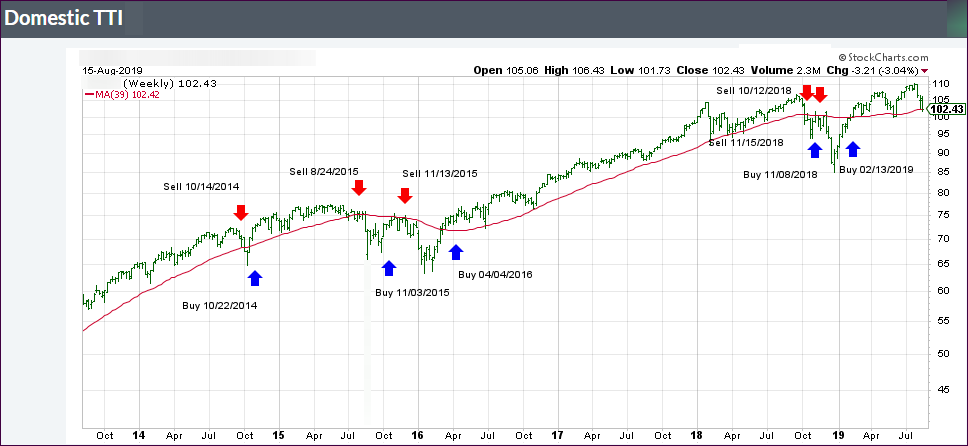
Our main directional indicator, the Domestic Trend Tracking Index (TTI-green line in the above chart) is now positioned above its long-term trend line (red) by +0.08% after having generated a new Domestic “Buy” signal effective 2/13/19 as posted.
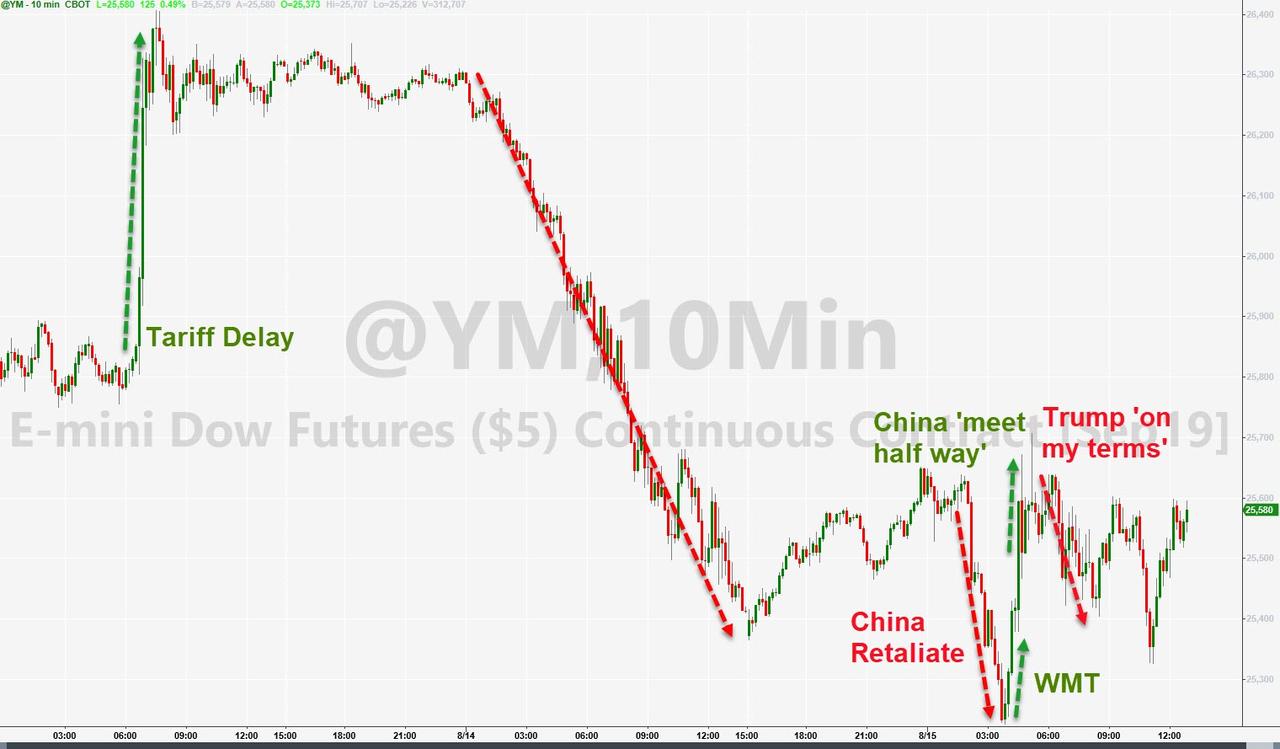
The market got an unexpected
assist, which prevented a continuation of yesterday’s slide; at least for the
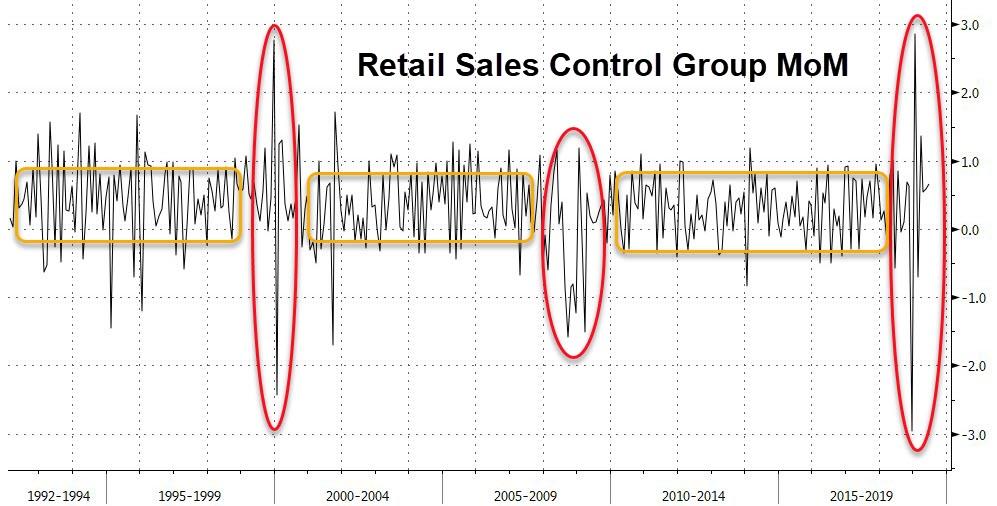
time being. Retail sales surged in July, but that does not mean all is well, as
these surges
in the past have been followed by contractions. But for this moment in time,
it was a positive with sales gushing +0.7% MoM vs. an expected +0.3%.
Then WalMart delivered better-than-expected
second quarter earnings, as well as same store sales growth, while projecting
even better numbers in the future. We also learned that US productivity increased
2.3% in the last quarter after a healthy 3.5% gain in the first 3 months.
These numbers put the
US-China trade dispute on the back burner, but a spokesman for China’s foreign
ministry seemed to throw out this olive branch:
“We hope the U.S. can
work in concert with China to implement the two presidents’ consensus that was
reached in Osaka, and to work out a mutually acceptable solution through
equal-footed dialogue and consultation with mutual respect.”
This was counter to an
earlier comment that threatened unspecified retaliation against Trump’s threat
to impose more tariffs in September. And so, the jawboning goes on…
The WSJ reported that the European
Central Bank (ECB) is in the process of revealing a stimulus package at its next
meeting in September that should exceed investors’ expectations. In other words,
things are so bad, economically speaking, that only a shock-and-awe effect will
revive Europe’s sagging economies.
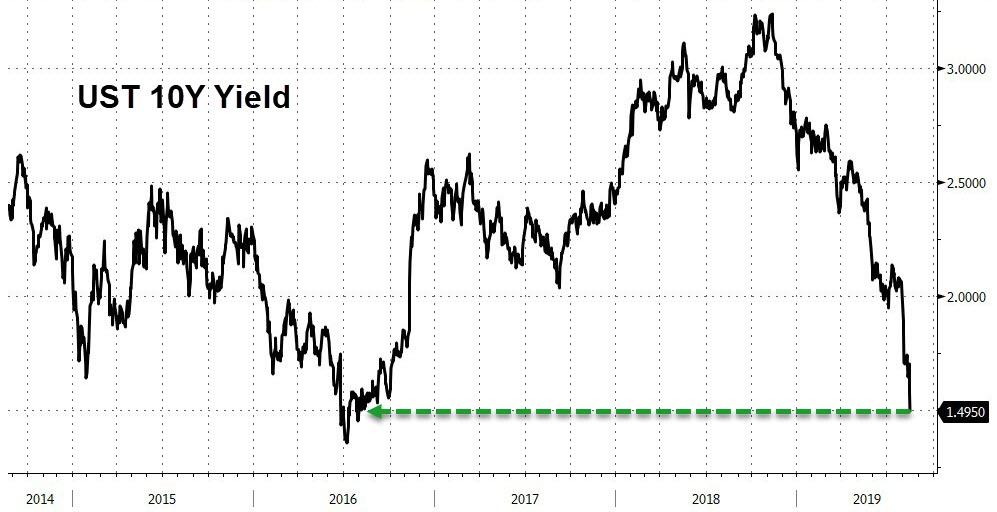
As a result, the 10-year US
bond yield took
a dive below the 1.5% level to touch 1.48% before rebounding. That was the lowest
price in three years and confirms that the race to the bottom will accelerate.
If you think, zero percent interest rates are simply insane, you are correct.
Look across the Atlantic towards
Denmark, where this idiocy has now morphed into negative mortgage rates. Denmark’s
3rd largest bank is now paying
people to take out a mortgage.
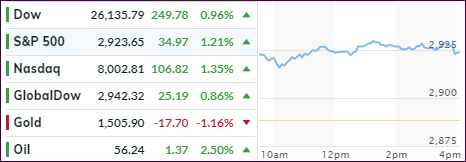
In the end, the markets meandered
aimlessly with the absence of bulls and bears marking a day that was
clouded by confusion and uncertainty. However, it was a good environment for those
of us holding the low volatility ETF SPLV, which advanced +1.11% vs. the SPY’s
more meager +0.26%.
Yesterday’s attempt by Trump
to put some lipstick on the trade pig, via a possible delay of certain tariffs,
now seems to have had only a one-day effect with global realities taking front
and center.
Newly released data shows a worrisome
development regarding economic growth with China and Europe’s economic powerhouse
Germany both presenting weak data. Chinese production slowed to 4.8% YoY, its lowest
level since 2002, while retails sales came in way below consensus. But at least
they’re showing positive numbers.
That can’t be said for Germany,
which showed its GDP contracting -0.1% in the second quarter, the first time since
the 3rd quarter of 2018. Much is contributed to the impending Brexit
later this year.
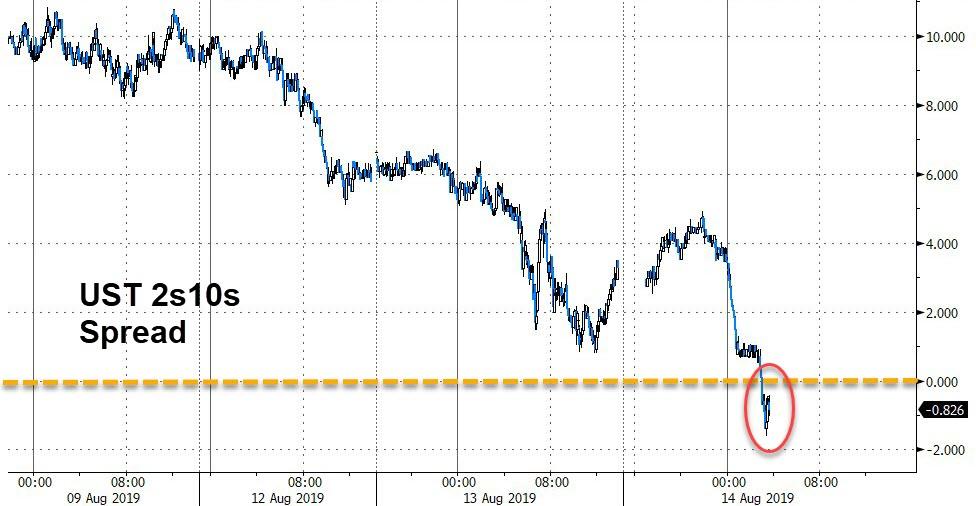
But the nail in the market’s
coffin, at least for today, was the bond market where the 2/10
yield inverted for the first time in 12 years. What that simply means is that,
if you invest in a 2-year bond, you will get a higher rate of return than for a
10-year bond. Insane! The 30-year
bond plunged to a record low yield as well.
This type of inversion
(2/10) has always signaled an upcoming recession, which is why we saw this violent
market move today. The damage was widely spread, but the low volatility SPLV softened
the blow somewhat (-1.98%) vs. the S&P 500’s -2.93%.
Our Trend Tracking Indexes
(TTIs) came under fire as well (see section 3), and the Domestic one has reached
a point that is within a hair of generating a ‘Sell’ signal. If this should materialize,
we could see more downside damage with the potential of re-visiting the December
lows now appearing to be a real possibility.
Of course, these days some
more bad news could be interpreted as good news by the speed-reading computer
algos, and we could be going back the other way.