
ETF Tracker StatSheet
You can view the latest version here.
A WAVE OF TRADE OPTIMISM SPEADS ACROSS MARKETS
- Moving the markets
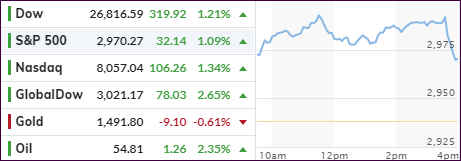
A sea of green spread across global markets, as trade war gloom turned into euphoria on nothing but optimism that a “skinny, lite or mini” deal between the U.S. and China would be announced momentarily.
Futures jumped and that feel-good momentum carried over into the regular session with Trump calling the first day of trade talks with China in over two months “very, very good.”
Another assist came overnight from a Chinese state newspaper saying that a “partial” deal would benefit both parties and suggested that Washington should take the offer on the table.
Then Vice Premier Liu He, the chief negotiator, chimed in that the “Chinese came with great sincerity” while adding that “not only would it be of tangible benefit by breaking the impasse, but it would also create badly needed breathing space for both sides to reflect on the bigger picture.”
In the end, Trump said that the U.S. has reached a “substantial” phase one deal with China, along with a “partial” trade agreement that could “help lead to a truce and lay the groundwork for a broader deal.”
These mostly meaningless words hit the newswire just prior to the markets closing, and the Dow sold off quickly by 200 points, but nonetheless, it was a good day for the major indexes. Due to rising interest rates, the low volatility ETF SPLV lagged SPY but remains ahead by a wide margin for this current ‘Buy’ cycle (+12.81% vs. +7.73%).
Pretty much out of nowhere, and subdued by trade talk taking front and center, was the Fed’s totally unexpected announcement of Quantitative Easing (QE), which they insisted is “Not a QE.”
Well, if it walks like a duck and quacks like a duck, odds are high that is a duck. The Fed will start buying up to $60 billion in T-Bills per month starting next week. ZH summed it up succinctly:
But wait there’s more, because just as today’s surprising spike in repo use suggested, mere “NOT A QE” may not cut it, and just in case, in order to provide an “ample supply of reserves”, the Fed will continue with $75BN in overnight repos and $35 billion in term repos twice per week, “at least through January of next year.”
To me, this is nothing but a bank bailout in disguise. I have opined on the “financial plumbing” issues in the overnight repo market, which had calmed down over the past couple of days. Today’s spike in demand may have been the trigger for the Fed to act, which some analysts had forecast not until November.
The markets totally ignored this development, but I believe there will be a fallout reaction by equities—possibly sooner rather than later. We may find out as soon as next week, unless the trade enthusiasm continues with full force to take front and center.
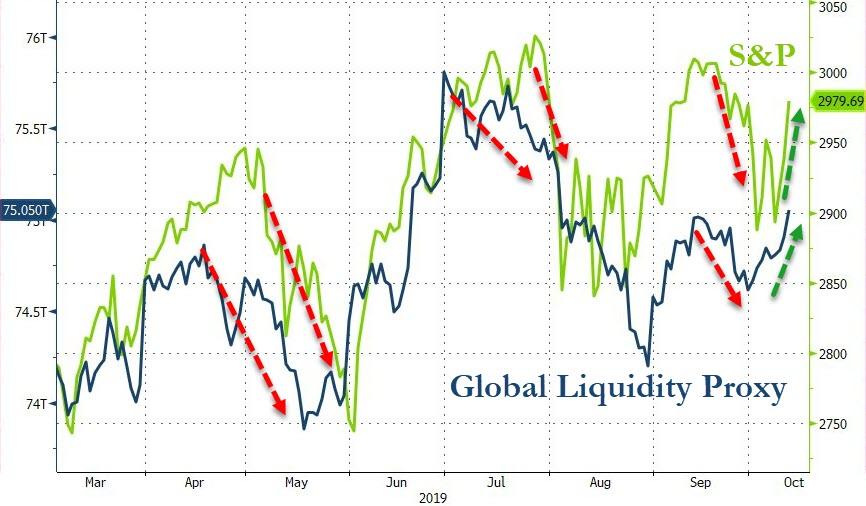
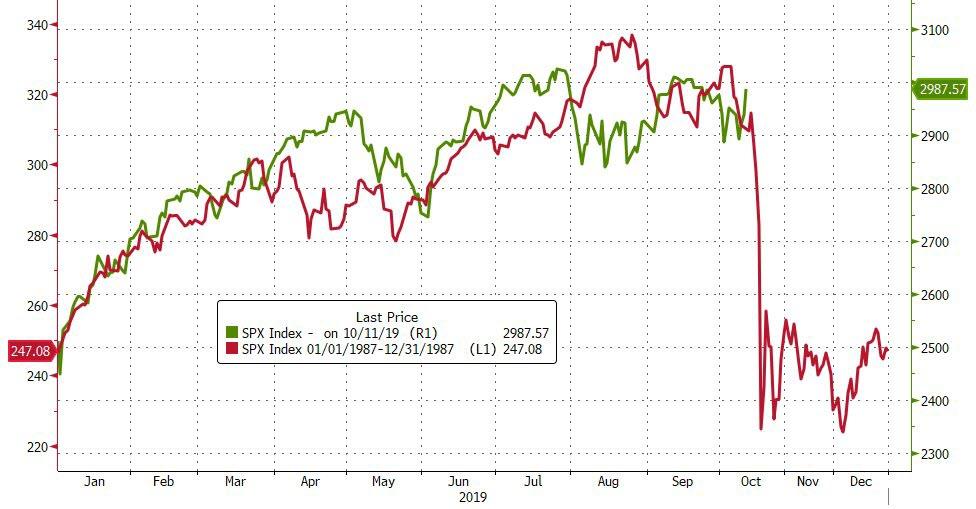
However, when looking at the global picture, it’s liquidity that provides the fuel to power markets, as this chart clearly demonstrates. At the same time, the comparison to the events of 1987 are striking. Could this really happen again?
2. ETFs in the Spotlight
In case you missed the announcement and description of this section, you can read it here again.
It features 10 broadly diversified and sector ETFs from my HighVolume list as posted every Saturday. Furthermore, they are screened for the lowest MaxDD% number meaning they have been showing better resistance to temporary sell offs than all others over the past year.
The below table simply demonstrates the magnitude with which some of the ETFs are fluctuating regarding their positions above or below their respective individual trend lines (%+/-M/A). A break below, represented by a negative number, shows weakness, while a break above, represented by a positive percentage, shows strength.
For hundreds of ETF choices, be sure to reference Thursday’s StatSheet.
For this current domestic “Buy” cycle, here’s how some our candidates have fared:
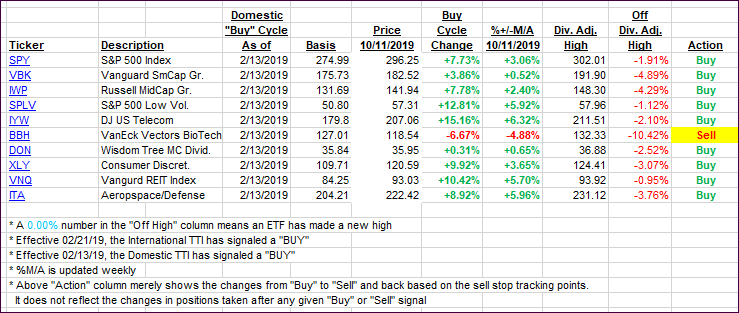
Again, the %+/-M/A column above shows the position of the various ETFs in relation to their respective long-term trend lines, while the trailing sell stops are being tracked in the “Off High” column. The “Action” column will signal a “Sell” once the -8% point has been taken out in the “Off High” column. For more volatile sector ETFs, the trigger point is -10%.
3. Trend Tracking Indexes (TTIs)
Our Trend Tracking Indexes (TTIs) jumped as it was “all-day trade” talk that kept the algos on a bullish path.
Here’s how we closed 10/11/2019:
Domestic TTI: +2.31% above its M/A (prior close +1.25%)—Buy signal effective 02/13/2019
International TTI: +0.41% above its M/A (prior close -1.16%)—Sell signal effective 10/03/2019
Disclosure: I am obliged to inform you that I, as well as my advisory clients, own some of the ETFs listed in the above table. Furthermore, they do not represent a specific investment recommendation for you, they merely show which ETFs from the universe I track are falling within the specified guidelines.
———————————————————-
WOULD YOU LIKE TO HAVE YOUR INVESTMENTS PROFESSIONALLY MANAGED?
Do you have the time to follow our investment plans yourself? If you are a busy professional who would like to have his portfolio managed using our methodology, please contact me directly or get more details here.
———————————————————
Back issues of the ETF Tracker are available on the web.
Contact Ulli