Just a note to let you know that I will be out of the office all day and will not have a chance to write today’s market commentary.
Regular posting will resume on Thursday.
Ulli…

Just a note to let you know that I will be out of the office all day and will not have a chance to write today’s market commentary.
Regular posting will resume on Thursday.
Ulli…
[Chart courtesy of MarketWatch.com]
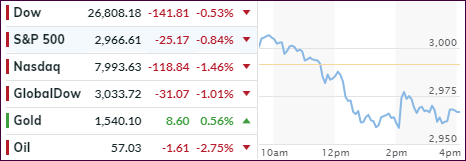
Early hopes, that successful trade talks might be on deck during October, were dashed today when Trump criticized China in no uncertain terms during his UN speech.
The result was that the early rally shifted in reverse with the pullback accelerating and pushing the major indexes deeper in the red. Things worsened when Speaker Nancy Pelosi put some new lipstick on an old pig, namely impeachment proceedings, which rattled traders and algos alike leaving the bears in charge for this session.
Despite an afternoon attempt to revive some bullish momentum, the damage was done, and the S&P 500 moved further away from its psychologically important 3k milestone marker.
Not helping at all was the latest report on Consumer Confidence showing the index falling to 125.1 from a previous 134.2. Analysts were quick to point out that the trade tensions with China were a contributing factor.
Even plunging bond yields, which saw their biggest drop in a month, couldn’t do anything to counter the triple whammy: Trump being negative on China, Consumer Confidence tumbling and impeachment headlines.
On a personal note, I want to let you know that I will be out of the office all day tomorrow and won’t be able to write the market commentary. Regular posting will resume on Thursday.
Read More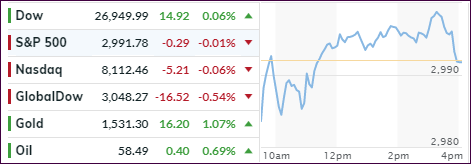
[Chart courtesy of MarketWatch.com]
Early aimless meandering turned into a modest rally mid-day, but positive momentum faded in the end with the major indexes diving into the close with nothing to show for.
It came as no surprise that defensive sectors, such as consumer staples, led for most of the day, as the ‘weaker growth’ meme was present. This became abundantly clear as manufacturing data in the Eurozone contracted sharply in September and notching its worst reading in almost 7 years.
The data was simply awful for Germany, which is seen by many as Europe’s economic engine, but a report indicated that business conditions continue to deteriorate with the no end in sight. This obviously was known to the ECB when the lowered interest rates again last week. Things indeed look bleak for the Eurozone when their historically best performer and exporter is mired in what appears to be a recession.
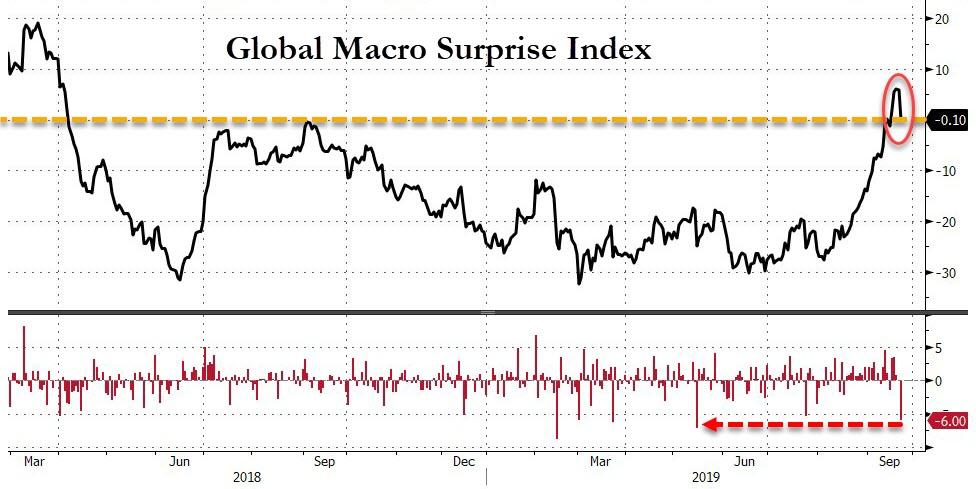
And it’s not just Europe that is showing poor numbers, we also learned that powerhouse South Korea saw its exports collapse the most since 2009. Overall, it was the worst global data disappointment day since May and pushed the index back into contraction.
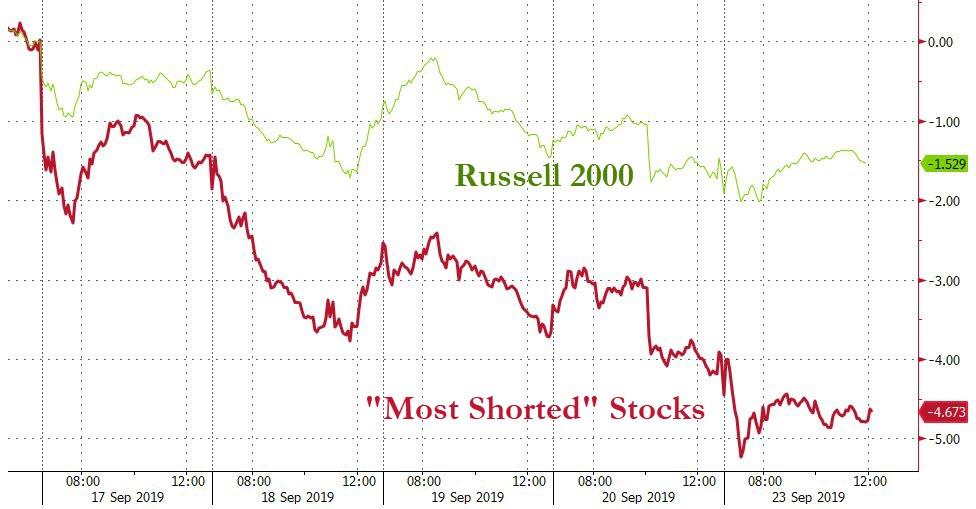
There was no short squeeze today, as the most shorted stocks did what they’re supposed to—namely head south, which they did for the 5th day in a row.
Since the indexes are within striking distance of hitting new all-time highs, we need a better driver to accomplish this than constantly worsening global economic data.
Read MoreBelow, please find the latest High-Volume ETF Cutline report, which shows how far above or below their respective long-term trend lines (39-week SMA) my currently tracked ETFs are positioned.
This report covers the HV ETF Master List from Thursday’s StatSheet and includes 322 High Volume ETFs, defined as those with an average daily volume of more than $5 million, of which currently 259 (last week 270) are hovering in bullish territory. The yellow line separates those ETFs that are positioned above their trend line (%M/A) from those that have dropped below it.
Take a look:
The HV ETF Master Cutline Report
In case you are not familiar with some of the terminology used in the reports, please read the Glossary of Terms. If you missed the original post about the Cutline approach, you can read it here.
ETF Tracker StatSheet
You can view the latest version here.
ENDING ON A WEAK NOTE
[Chart courtesy of MarketWatch.com]
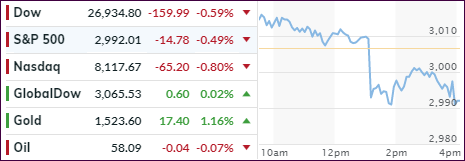
An early upturn hit the skids after a report that a Chinese delegation had canceled plans to visit farms in Montana, as part of negotiations designed to sell more farming products. Helping the positive tone early on was news that Trump was exempting hundreds of Chinese products from tariffs.
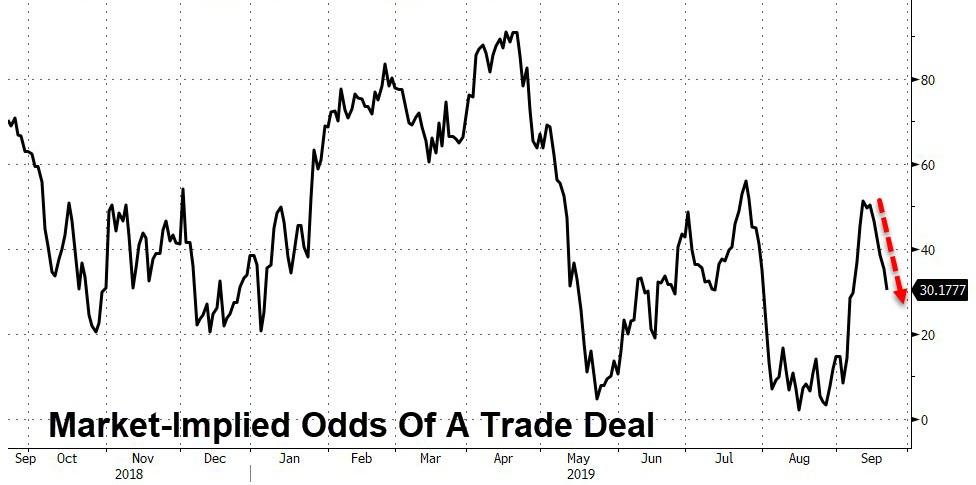
Things fell apart when it became known that Trump wanted a “complete” deal and not just a temporary agreement to promote U.S. agricultural goods. The trade mood went from bad to worse when he then added that he “does not need a China deal before the election,” causing the Trade Deal odds to tumble.
Even the Fed, with its current battle to control the greatest liquidity crisis in overnight repos in over a decade, seems to be confused, as two of its talking heads offered opposing opinions, according to ZH:
So, which is it?
That kind of split within the Fed makes me realize that there are no certainties in the current market environment. That’s why it remains to be of great importance to have an exit strategy in place, so we don’t get caught on the wrong side, should things fall apart.
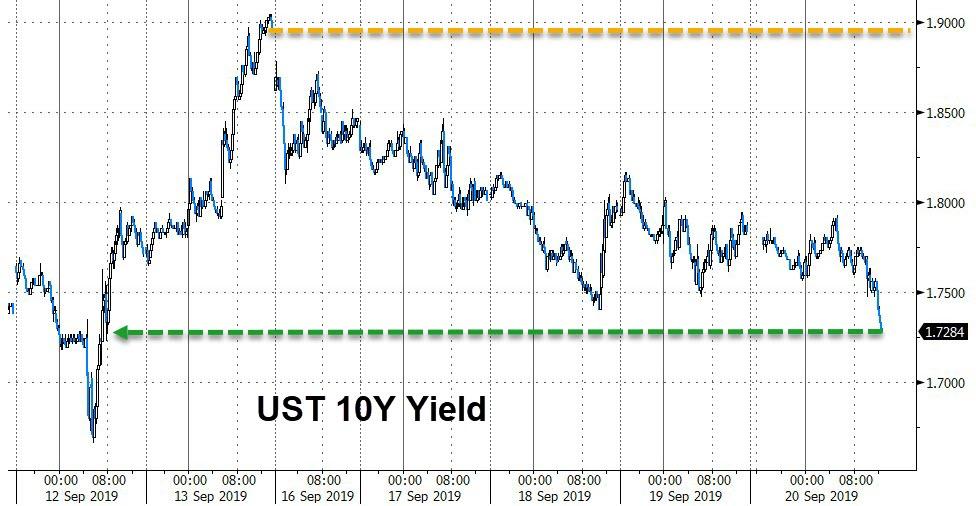
For the week, the major indexes slipped and so did bond yields, which came off their recent highs with the 10-year dropping from 1.9% to 1.73%, as this chart shows.
We’ll have to wait and see if this softening of bond yields is a sign of more to come, which should help equities to move out of this week’s doldrums.
On the other hand, the Fed’s emergency liquidity measures in the overnight lending market, if not resolved satisfactorily, could extract a pound of flesh from equities when trading resumes next week.
Read MoreETF Data updated through Thursday, September 19, 2019
Methodology/Use of this StatSheet:
1. From the universe of over 1,800 ETFs, I have selected only those with a trading volume of over $5 million per day (HV ETFs), so that liquidity and a small bid/ask spread are assured.
2. Trend Tracking Indexes (TTIs)
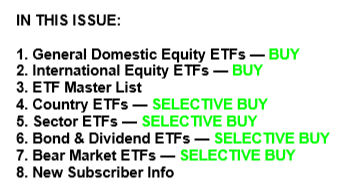
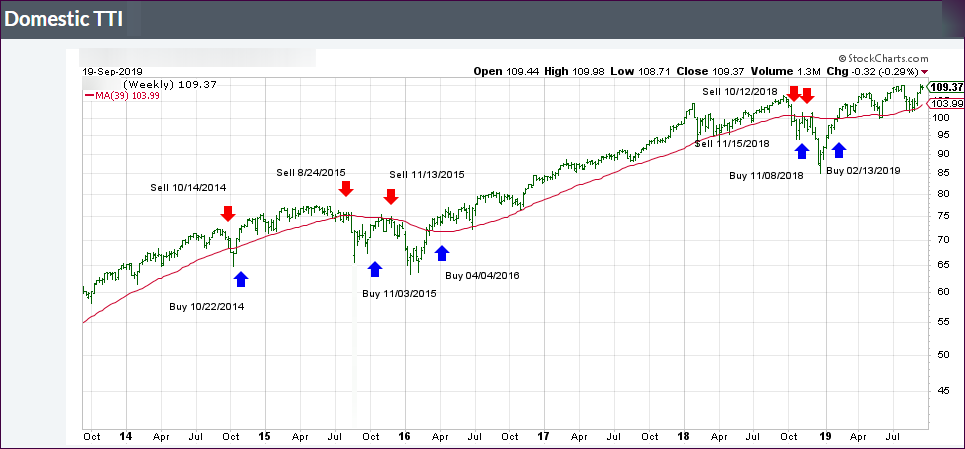
Buy or Sell decisions for Domestic and International ETFs (section 1 and 2), are made based on the respective TTI and its position either above or below its long-term M/A (Moving Average). A crossing of the trend line from below accompanied by some staying power above constitutes a “Buy” signal. Conversely, a clear break below the line constitutes a “Sell” signal. Additionally, I use a 7.5% trailing stop loss on all positions in these categories to control downside risk.
3. All other investment arenas do not have a TTI and should be traded based on the position of the individual ETF relative to its own respective trend line (%M/A). That’s why those signals are referred to as a “Selective Buy.” In other words, if an ETF crosses its own trendline to the upside, a “Buy” signal is generated. Since these areas tend to be more volatile, I recommend a wider trailing sell stop of 7.5% -10% depending on your risk tolerance.
If you are unfamiliar with some of the terminology, please see Glossary of Terms and new subscriber information in section 9.
1. DOMESTIC EQUITY ETFs: BUY — since 02/13/2019
Click on chart to enlarge
Our main directional indicator, the Domestic Trend Tracking Index (TTI-green line in the above chart) is now positioned above its long-term trend line (red) by +5.74% after having generated a new Domestic “Buy” signal effective 2/13/19 as posted.
Read More