
- Moving the markets
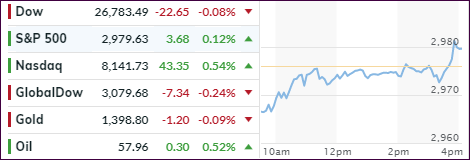
An early slide managed to gain some traction, followed by a small rebound that had the S&P 500 hugging its unchanged line throughout most of the session, before a last-minute pump pushed the index into the green by a tiny margin.
The outlook for interest rate reductions later this month has become clouded, thanks to last week’s stronger than expected June jobs report, but Wall Street traders still are clinging to hope that a 0.25% cut will materialize.
While the whisper number was a 0.5% reduction, which had been largely priced in, it makes anything less question traders as to the success of such an effort. Remember, Wall Street is spoiled and addicted to lower rates, without which a continuation of the bull market becomes questionable. We saw the result of a disappointing Fed by the market reaction last year.
In the end, the markets did nothing and may not move much in either direction until the Fed clarifies its policy. With this having been a relatively quiet day, ZH decided to post the current S&P performance when overlaid on the 1987 market debacle.
I can’t wait to see how that will turn out.
2. ETFs in the Spotlight
In case you missed the announcement and description of this section, you can read it here again.
It features 10 broadly diversified and sector ETFs from my HighVolume list as posted every Saturday. Furthermore, they are screened for the lowest MaxDD% number meaning they have been showing better resistance to temporary sell offs than all others over the past year.
The below table simply demonstrates the magnitude with which some of the ETFs are fluctuating regarding their positions above or below their respective individual trend lines (%+/-M/A). A break below, represented by a negative number, shows weakness, while a break above, represented by a positive percentage, shows strength.
For hundreds of ETF choices, be sure to reference Thursday’s StatSheet.
For this current domestic “Buy” cycle, here’s how some our candidates have fared:
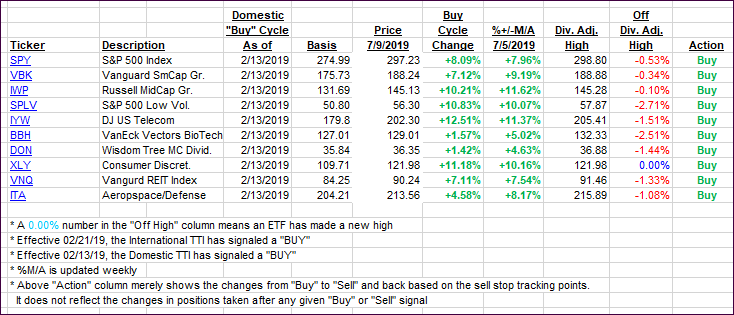
Again, the %+/-M/A column above shows the position of the various ETFs in relation to their respective long-term trend lines, while the trailing sell stops are being tracked in the “Off High” column. The “Action” column will signal a “Sell” once the -8% point has been taken out in the “Off High” column. For more volatile sector ETFs, the trigger point is -10%.
3. Trend Tracking Indexes (TTIs)
Our Trend Tracking Indexes (TTIs) dropped a tad as markets meandered sideways.
Here’s how we closed 07/09/2019:
Domestic TTI: +7.45% above its M/A (last close +7.48%)—Buy signal effective 02/13/2019
International TTI: +4.28% above its M/A (last close +4.52%)—Buy signal effective 06/19/2019
Disclosure: I am obliged to inform you that I, as well as my advisory clients, own some of the ETFs listed in the above table. Furthermore, they do not represent a specific investment recommendation for you, they merely show which ETFs from the universe I track are falling within the specified guidelines.
Contact Ulli