
- Moving the markets
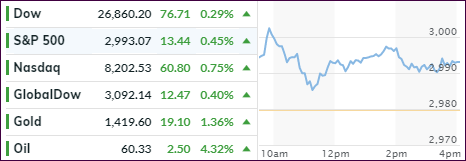
The markets opened higher, pulled back but maintained its presence safely above the unchanged line. The S&P 500 succeeded in briefly crawling above its 3,000-milestone marker, retreated in a hurry but managed to close in the green, as did the other 2 major indexes. The Nasdaq fared the best by sporting a +0.75% gain.
All eyes were on Fed chief Powell, who acknowledged that the U.S. “is suffering from a bout of uncertainty caused by trade tensions and weak global growth,” but he promised to “do whatever it takes” to prop up the economy. Of course, traders took that as a sign that lower interest rates are on deck, which helped the bullish cause for the day.
The Fed illuminated things even further by stating that they will “act as appropriate to sustain the expansion,” which lent further support to those hoping for a rate cut. Powell also kept repeatedly emphasizing the effect of trade tensions and a slower growth around the world.
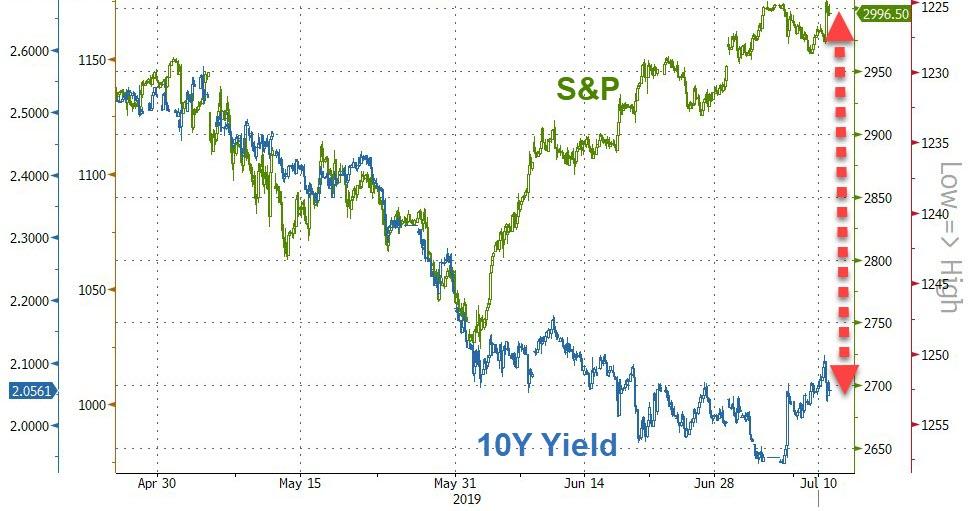
Again, the entire scenario appears to be backwards to me. Here we have the S&P 500 hugging the 3,000-milestone, yet Powell indicates that rate cuts are on the horizon. To be clear, rate cuts are usually implemented to support a sagging economy and not pump up markets.
On the other hand, it could very well be that, as I posted before, the economy is in such bad shape that lower rates are required to keep it alive, yet the stock market (the ‘dumb’ money as opposed the bond market representing the ‘smart’ money), is as usual the last one to get the message.
When will these jaws of reality finally snap shut?
2. ETFs in the Spotlight
In case you missed the announcement and description of this section, you can read it here again.
It features 10 broadly diversified and sector ETFs from my HighVolume list as posted every Saturday. Furthermore, they are screened for the lowest MaxDD% number meaning they have been showing better resistance to temporary sell offs than all others over the past year.
The below table simply demonstrates the magnitude with which some of the ETFs are fluctuating regarding their positions above or below their respective individual trend lines (%+/-M/A). A break below, represented by a negative number, shows weakness, while a break above, represented by a positive percentage, shows strength.
For hundreds of ETF choices, be sure to reference Thursday’s StatSheet.
For this current domestic “Buy” cycle, here’s how some our candidates have fared:
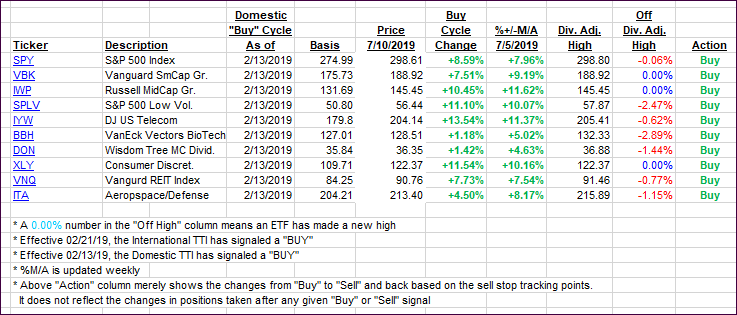
Again, the %+/-M/A column above shows the position of the various ETFs in relation to their respective long-term trend lines, while the trailing sell stops are being tracked in the “Off High” column. The “Action” column will signal a “Sell” once the -8% point has been taken out in the “Off High” column. For more volatile sector ETFs, the trigger point is -10%.
3. Trend Tracking Indexes (TTIs)
Our Trend Tracking Indexes (TTIs) inched up as Powell’s testimony was dovish enough to keep traders happy.
Here’s how we closed 07/10/2019:
Domestic TTI: +7.56% above its M/A (last close +7.45%)—Buy signal effective 02/13/2019
International TTI: +4.69% above its M/A (last close +4.28%)—Buy signal effective 06/19/2019
Disclosure: I am obliged to inform you that I, as well as my advisory clients, own some of the ETFs listed in the above table. Furthermore, they do not represent a specific investment recommendation for you, they merely show which ETFs from the universe I track are falling within the specified guidelines.
Contact Ulli