
- Moving the markets
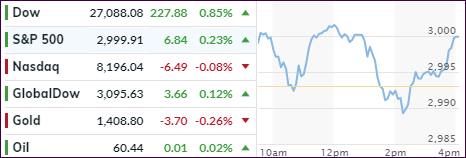
While the Dow managed to conquer its new milestone marker of 27,000 with relative ease, and close above it, the S&P 500 struggled with its record 3,000 level. It managed to trade above it for a brief period but fell just short of defeating that hurdle by ending the day at 2,999.91.
It was another day of trading in a wide range, as an early rally lost steam with equities taking a sudden dive towards the unchanged line after Trump tweeted his dissatisfaction with China’s efforts about the trade truce.
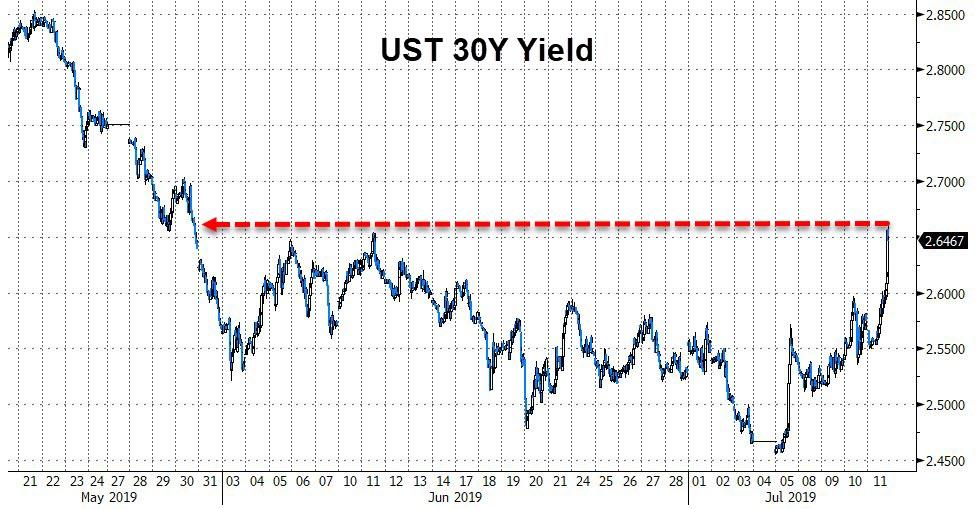
Market disappointment was short lived with the rally resuming only to lose steam again with the indexes summersaulting but this time below the unchanged line. This was due to a poor bond auction, as the 30-year yield exploded to 6-week highs. However, as if by magic, the third attempt to take out the old highs was accompanied by some staying power with only the Nasdaq ending slightly in the red.
Some pain for Fed head Powell’s dovish ideas arrived in form of a hotter than expected core inflation rate, which rose 0.3% from the prior month to 2.1%, which is not just the most since January 2018 but also above the Fed’s 2% target.
How does a higher inflation rate compute with the intention of lowering interest rates? Not very well, in my opinion. The Fed will have some hard decisions to make when it meets later this month.
2. ETFs in the Spotlight
In case you missed the announcement and description of this section, you can read it here again.
It features 10 broadly diversified and sector ETFs from my HighVolume list as posted every Saturday. Furthermore, they are screened for the lowest MaxDD% number meaning they have been showing better resistance to temporary sell offs than all others over the past year.
The below table simply demonstrates the magnitude with which some of the ETFs are fluctuating regarding their positions above or below their respective individual trend lines (%+/-M/A). A break below, represented by a negative number, shows weakness, while a break above, represented by a positive percentage, shows strength.
For hundreds of ETF choices, be sure to reference Thursday’s StatSheet.
For this current domestic “Buy” cycle, here’s how some our candidates have fared:
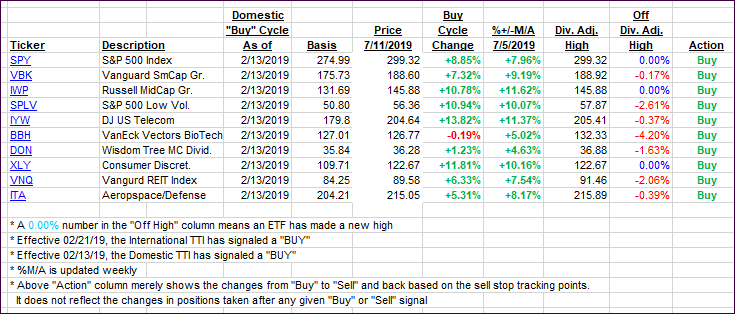
Again, the %+/-M/A column above shows the position of the various ETFs in relation to their respective long-term trend lines, while the trailing sell stops are being tracked in the “Off High” column. The “Action” column will signal a “Sell” once the -8% point has been taken out in the “Off High” column. For more volatile sector ETFs, the trigger point is -10%.
3. Trend Tracking Indexes (TTIs)
Our Trend Tracking Indexes (TTIs) headed slightly north, as a whip-saw kind of day favored the bulls in the end.
Here’s how we closed 07/11/2019:
Domestic TTI: +7.78% above its M/A (last close +7.56%)—Buy signal effective 02/13/2019
International TTI: +4.80% above its M/A (last close +4.69%)—Buy signal effective 06/19/2019
Disclosure: I am obliged to inform you that I, as well as my advisory clients, own some of the ETFs listed in the above table. Furthermore, they do not represent a specific investment recommendation for you, they merely show which ETFs from the universe I track are falling within the specified guidelines.
Contact Ulli