After 1-1/2 years of trade
negotiations, last Friday’s “mini-deal,” if you can even call it that, cast
some more doubt on the substance of what was accomplished. The words “deal” or “substantial”
just don’t fit the picture of what some analysts have called nothing more than
a “farm package.”
China has agreed to increase
its purchases of US farm products up to $40 to $50 billion with no time limit
attached, while the U.S. postponed planned increases in tariffs. That was the
entire story upon which the computer algos went crazy and drove the Dow up over
300 points.
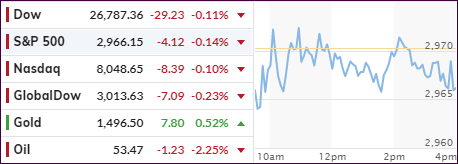
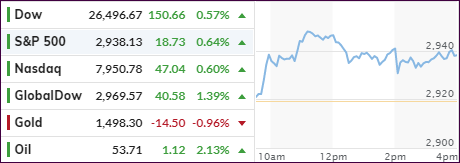
While today’s lackluster
session was as much a function of the bond markets being closed for Columbus
Day, a big contributor to the lack of buying was the general perception that
the “phase 1” China deal will not improve trade barriers nor encourage economic
growth any time soon.
Not helping matters was a report
from Morgan Stanley calling last Friday’s close to be the
high for stocks with selling now being on deck, as they see the trade truce
to be disappointing and a boon for the bears.
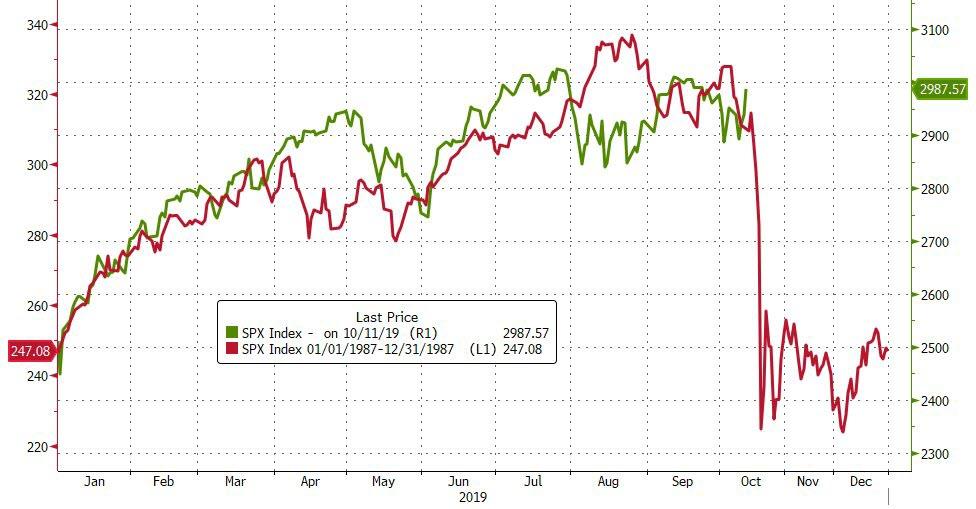
However, markets could break
in either direction, if you look at this updated
chart from Bloomberg, which makes the case that, based on history, we could
see a repeat of 1987 or 2013. If the perceived accuracy of this chart continues,
we will find out the answer real soon.
Below, please find the latest High-Volume ETF Cutline
report, which shows how far above or below their respective long-term trend
lines (39-week SMA) my currently tracked ETFs are positioned.
This report covers the HV ETF Master List from Thursday’s
StatSheet and includes 322 High Volume ETFs, defined as those with an average
daily volume of more than $5 million, of which currently 224 (last week 226)
are hovering in bullish territory. The yellow line separates those ETFs that
are positioned above their trend line (%M/A) from those that have dropped below
it.
In case you are not familiar
with some of the terminology used in the reports, please read the Glossary of Terms.
If you missed the original
post about the Cutline approach, you can read it here.
A sea of green spread across global markets,
as trade war gloom turned into euphoria on nothing but optimism that a “skinny,
lite or mini” deal between the U.S. and China would be announced momentarily.
Futures jumped and that feel-good momentum
carried over into the regular session with Trump calling the first day of trade
talks with China in over two months “very, very good.”
Another assist came overnight from a Chinese state
newspaper saying that a “partial” deal would benefit both parties and suggested
that Washington should take the offer on the table.
Then Vice Premier Liu He, the chief negotiator,
chimed in that the “Chinese came with great sincerity” while adding that
“not only would it be of tangible benefit by breaking the impasse, but it
would also create badly needed breathing space for both sides to reflect on the
bigger picture.”
In the end, Trump said that the U.S. has reached
a “substantial” phase one deal with China, along with a “partial” trade
agreement that could “help lead to a truce and lay the groundwork for a
broader deal.”
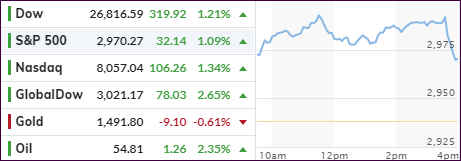
These mostly meaningless words hit the newswire
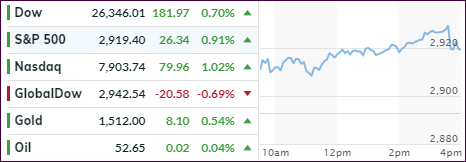
just prior to the markets closing, and the Dow sold off quickly by 200 points,
but nonetheless, it was a good day for the major indexes. Due to rising
interest rates, the low volatility ETF SPLV lagged SPY but remains ahead by a
wide margin for this current ‘Buy’ cycle (+12.81% vs. +7.73%).
Pretty much out of nowhere, and subdued by trade
talk taking front and center, was the Fed’s totally unexpected announcement of Quantitative
Easing (QE), which they insisted is “Not a QE.”
Well, if it walks like a duck and quacks like
a duck, odds are high that is a duck. The Fed will start buying up to $60
billion in T-Bills per month starting next week. ZH summed it up succinctly:
But wait there’s more, because just as
today’s surprising spike in repo use suggested, mere “NOT A QE” may
not cut it, and just in case, in order to provide an “ample supply of
reserves”, the Fed will continue with $75BN in overnight repos and $35
billion in term repos twice per week, “at least through January of next
year.”
To me, this is nothing but a bank bailout in
disguise. I have opined on the “financial plumbing” issues in the overnight repo
market, which had calmed down over the past couple of days. Today’s spike in demand
may have been the trigger for the Fed to act, which some analysts had forecast
not until November.
The markets totally ignored this development,
but I believe there will be a fallout reaction by equities—possibly sooner rather
than later. We may find out as soon as next week, unless the trade enthusiasm
continues with full force to take front and center.
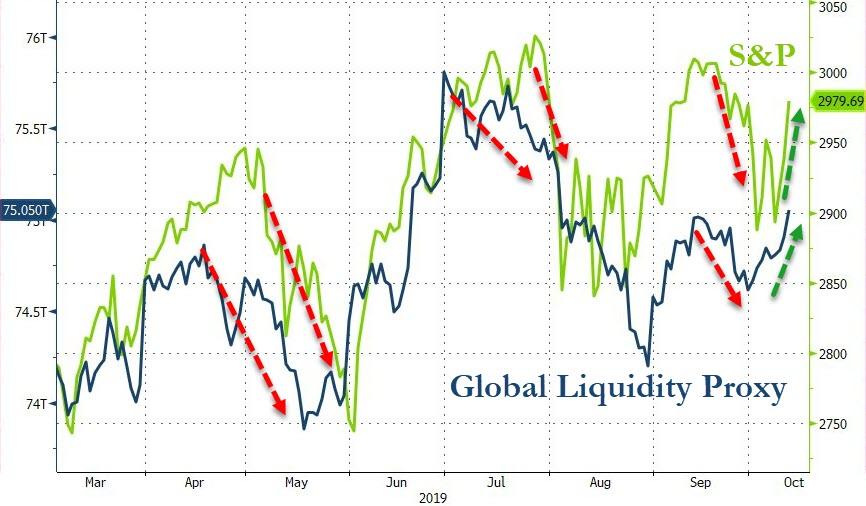
However, when looking at the global picture, it’s
liquidity that provides the fuel to power markets, as this
chart clearly demonstrates. At the same time, the comparison to the events
of 1987 are striking. Could this
really happen again?
ETF Data
updated through Thursday, October 10, 2019
Methodology/Use of this StatSheet:
1. From the universe of over 1,800 ETFs, I have selected only those with a
trading volume of over $5 million per day (HV ETFs), so that liquidity and a
small bid/ask spread are assured.
2. Trend Tracking Indexes (TTIs)
Buy or Sell decisions for Domestic and International ETFs (section 1 and
2), are made based on the respective TTI and its position either above or below
its long-term M/A (Moving Average). A crossing of the trend line from below
accompanied by some staying power above constitutes a “Buy” signal. Conversely,
a clear break below the line constitutes a “Sell” signal. Additionally, I use a
7.5% trailing stop loss on all positions in these categories to control
downside risk.
3. All other investment arenas do not have a TTI and should be traded
based on the position of the individual
ETF relative to its own respective trend line (%M/A). That’s why those signals
are referred to as a “Selective Buy.” In other words, if an ETF crosses its own
trendline to the upside, a “Buy” signal is generated. Since these areas tend to
be more volatile, I recommend a wider trailing sell stop of 7.5% -10% depending
on your risk tolerance.
If you are unfamiliar with some of the terminology, please see Glossary of Termsand new subscriber information in section 9.
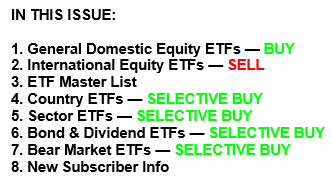
1. DOMESTIC EQUITY ETFs: BUY
— since 02/13/2019
Click on chart to enlarge
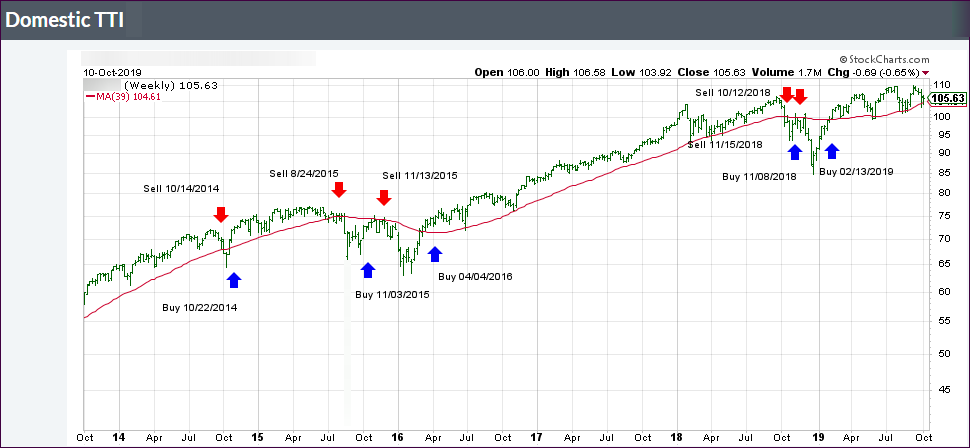
Our main directional indicator, the Domestic Trend Tracking Index (TTI-green line in the above chart) is now positioned above its long-term trend line (red) by +1.25% after having generated a new Domestic “Buy” signal effective 2/13/19 as posted.
Well, it sure didn’t take
much effort to keep the markets going, as Trump successfully dangled the trade
carrot again via this tweet:
“Big day of negotiations
with China. They want to make a deal, but do I? I meet with the Vice Premier
tomorrow at The White House.”
While this did not indicate
really anything, the computer algos saw it as a positive, since China’s chief
trade negotiator Vice Premier Liu He is staying in town till Friday, at least
for now. That was all it took to ramp the markets higher in a vain attempt to get
back to even for the week.
However, a US-China deal is
based on nothing but hope, because as ZH noted correctly:
“The US has not changed
its extensive and rigorous requests for China, nor has it responded to China’s
core concerns,” Renmin University international relations professor Shi
Yinhong said.
“Even if there is a deal, it
could only be a mini-deal, even a minimal mini-deal. A currency pact, if true,
does not bring any substance.”
But optimism is all that
matters, so we’ll have to wait and see how this movie plays out. Given recent history,
this could very well turn into another head fake.
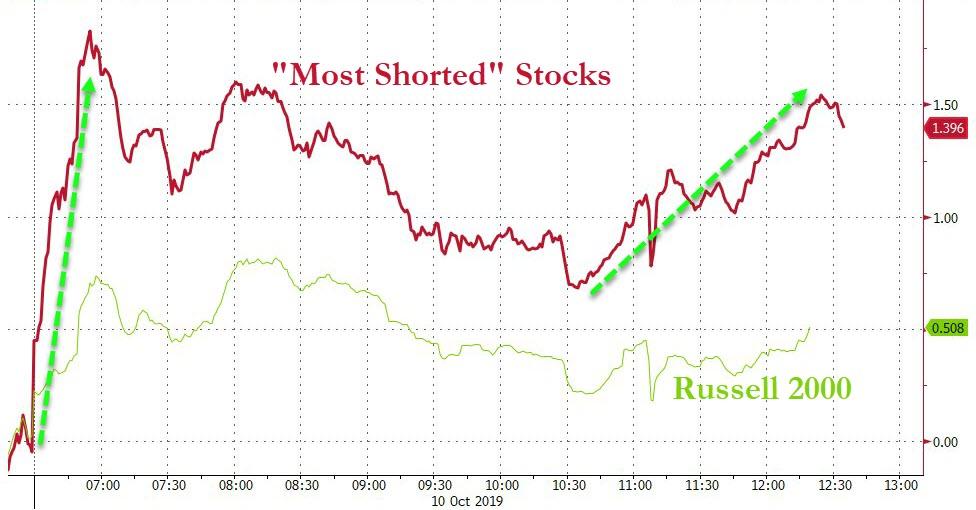
In the meantime, the major
indexes managed to whipsaw around above their respective unchanged lines and scored
another winning session for the second day in row, which was in part supported
by a short
squeeze in SmallCaps.
Still, the S&P 500 needs
to gain about 1.3% from today’s level in order to reach last Friday’s close.
It seems like yesterday’s trade
jawboning between the US and China had taken on too harsh of a tone, so both parties
attempted to ease festering tensions. News reports indicated that China was open
to a “limited or partial tariff solution” while offering to increase purchases of
agricultural products from US farmers to $50 billion.
That was enough of a driver
to push the indexes higher, despite weak domestic data showing Job Openings
plunging to a 17-month low and confirming that Hiring/Quitting continues to remain
on a slippery slope.
Then the Minutes from the last
FOMC meeting on interest rates showed that officials have become somewhat concerned
about the state of the economy with some members arguing that the chances of a
U.S. recession “had increased notably in recent months.”
While that is a negative, it
is not one in today’s environment, where stock market levels are largely supported
by ever decreasing interest rates. And, a recessionary environment pretty much guarantees
that rates will head lower, which is exactly what the markets anticipate when the
Fed meets later this month.
While today’s rebound
encouraged the bullish crowd, it’s noteworthy that this activity was
accompanied by very low volume, about 30% below average, which means the rally
was lacking conviction and may not have enough legs to continue.
Be that as it may, our Trend
Tracking Index (TTI), after slipping below its long-term trend line yesterday, mustered
enough strength to climb back above it by +0.49% indicating, at least for the
time being, that the bullish trend is still alive.