
- Moving the markets
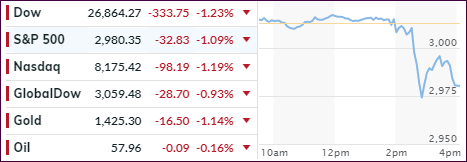
The Fed did what was expected by cutting interest rates by 0.25% for the first time in 11 years. Of course, on Wall Street, expectations don’t mean much, unless you beat them. The Fed failed to do that, and the markets tanked with the Dow at one point being down some 400 points.
What created most of the damage was Fed head Powell’s press conference, during which he appeared dazed and confused, after a barrage of questions forced him to explain his reasoning. He said that the US economy is doing great, confidence is rebounding, while the 0.25% was an “insurance” cut.
Then he revealed that today’s rate reduction was just a “mid-cycle” adjustment and not the start of a “long series of rate cuts.” That shook and stunned the markets, as several more cuts were assumed to be forthcoming. One analyst summarized it like this:
“The market was fine with the statement, but as seems to be the case, the press conference reveals details that do not sit well with the market. The response that this is a mid-cycle adjustment and not part of a longer-term accommodative stance has raised concerns. The market has really talked itself into a need for lower rates. Obviously the FOMC still feels strongly the economy is resilient.”
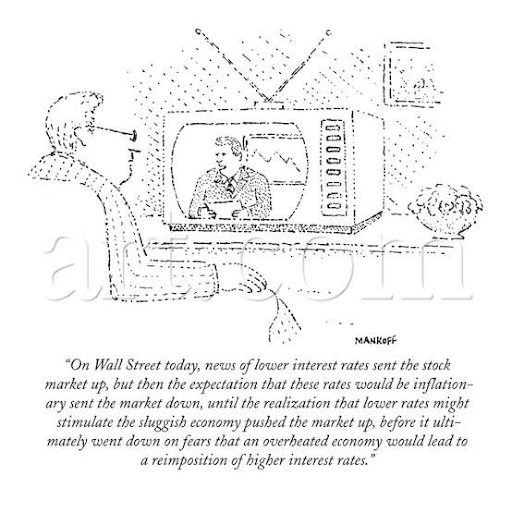
That means the widely anticipated easing cycle over the next six months will not happen, which this cartoon sums up perfectly. Powell now holds the dubious record of having held 12 press conference, of which 10 of them were followed by stocks tanking.
Still, while volatility returned with a vengeance today, for the month, the major indexes gained, led by the Nasdaq, while SmallCaps fared the worst.
It will be interesting to see if the markets will adjust to the “Powell theme,” or if there is more fallout to come over the next week or so.
2. ETFs in the Spotlight
In case you missed the announcement and description of this section, you can read it here again.
It features 10 broadly diversified and sector ETFs from my HighVolume list as posted every Saturday. Furthermore, they are screened for the lowest MaxDD% number meaning they have been showing better resistance to temporary sell offs than all others over the past year.
The below table simply demonstrates the magnitude with which some of the ETFs are fluctuating regarding their positions above or below their respective individual trend lines (%+/-M/A). A break below, represented by a negative number, shows weakness, while a break above, represented by a positive percentage, shows strength.
For hundreds of ETF choices, be sure to reference Thursday’s StatSheet.
For this current domestic “Buy” cycle, here’s how some our candidates have fared:
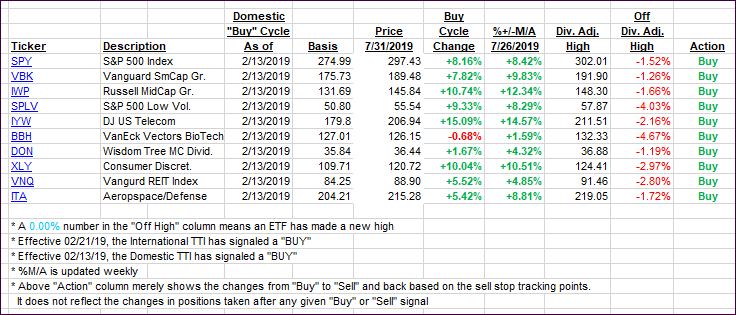
Again, the %+/-M/A column above shows the position of the various ETFs in relation to their respective long-term trend lines, while the trailing sell stops are being tracked in the “Off High” column. The “Action” column will signal a “Sell” once the -8% point has been taken out in the “Off High” column. For more volatile sector ETFs, the trigger point is -10%.
3. Trend Tracking Indexes (TTIs)
Our Trend Tracking Indexes (TTIs) headed south with markets reacting very bearish to the Fed’s rate cut.
Here’s how we closed 07/31/2019:
Domestic TTI: +6.56% above its M/A (last close +7.63%)—Buy signal effective 02/13/2019
International TTI: +3.11% above its M/A (last close +4.09%)—Buy signal effective 06/19/2019
Disclosure: I am obliged to inform you that I, as well as my advisory clients, own some of the ETFs listed in the above table. Furthermore, they do not represent a specific investment recommendation for you, they merely show which ETFs from the universe I track are falling within the specified guidelines.
Contact Ulli