
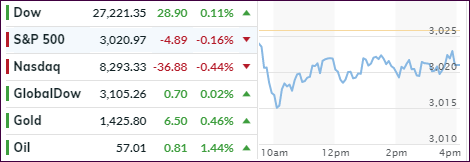
- Moving the markets
While the earnings season continues, traders were more
concerned with what the Fed will decide regarding interest rates, when it concludes
its two-day meeting on Wednesday. Will they deliver another hoped for
sugar high for the economy and the markets, or will the outcome be a dud?
A 0.25% reduction in rates has been baked in the cake, and any disappointment there would have negative consequences for equities. However, even if they meet this low end of expectations, and not reduce by the desired 0.5% whisper number, discontent may spread anyway, and we could witness a sell-off after the recent relentless move higher.
After all, eventually, investors and trades will wake up to the fact that lower rates are a sign of declining economic activity and not an indication that all is well. Rising rates represent an economy firing on all cylinders, a condition that therefore needs to be reigned in due to the possibility of inflation getting out of hand.
We will find out in a couple of days what the reaction will be and if traders will sell the Fed news. In the meantime, the markets will likely limp along directionless, as they did today.
2. ETFs in the Spotlight
In case you missed the announcement and description of this section, you can read it here again.
It features 10 broadly diversified and sector ETFs from my HighVolume list as posted every Saturday. Furthermore, they are screened for the lowest MaxDD% number meaning they have been showing better resistance to temporary sell offs than all others over the past year.
The below table simply demonstrates the magnitude with which some of the ETFs are fluctuating regarding their positions above or below their respective individual trend lines (%+/-M/A). A break below, represented by a negative number, shows weakness, while a break above, represented by a positive percentage, shows strength.
For hundreds of ETF choices, be sure to reference Thursday’s StatSheet.
For this current domestic “Buy” cycle, here’s how some our candidates have fared:
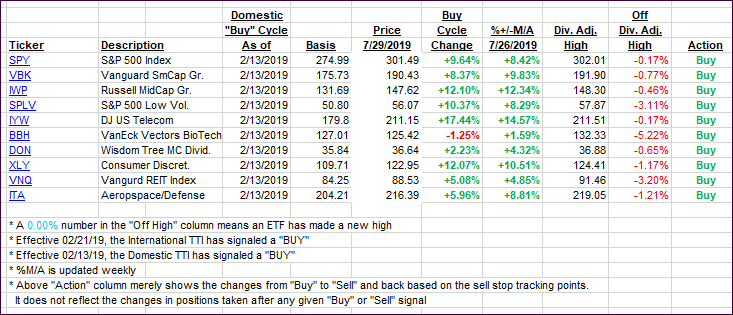
Again, the %+/-M/A column above shows the position of the various ETFs in relation to their respective long-term trend lines, while the trailing sell stops are being tracked in the “Off High” column. The “Action” column will signal a “Sell” once the -8% point has been taken out in the “Off High” column. For more volatile sector ETFs, the trigger point is -10%.
3. Trend Tracking Indexes (TTIs)
Our Trend Tracking Indexes (TTIs) barely changed as the major indexes showed a mixed picture ahead of the Fed.
Here’s how we closed 07/29/2019:
Domestic TTI: +7.56% above its M/A (last close +7.84%)—Buy signal effective 02/13/2019
International TTI: +4.67% above its M/A (last close +4.64%)—Buy signal effective 06/19/2019
Disclosure: I am obliged to inform you that I, as well as my advisory clients, own some of the ETFs listed in the above table. Furthermore, they do not represent a specific investment recommendation for you, they merely show which ETFs from the universe I track are falling within the specified guidelines.
Contact Ulli