Below, please find the latest High-Volume ETF Cutline
report, which shows how far above or below their respective long-term trend
lines (39-week SMA) my currently tracked ETFs are positioned.
This report covers the HV ETF Master List from Thursday’s
StatSheet and includes 322 High Volume ETFs, defined as those with an average
daily volume of more than $5 million, of which currently 250 (last week 224)
are hovering in bullish territory. The yellow line separates those ETFs that
are positioned above their trend line (%M/A) from those that have dropped below
it.
In case you are not familiar
with some of the terminology used in the reports, please read the Glossary of Terms.
If you missed the original
post about the Cutline approach, you can read it here.
This is an early and short version of Friday’s
commentary, since I will be tied up this afternoon. The markets are still open
and will be for another 3.5 hours.
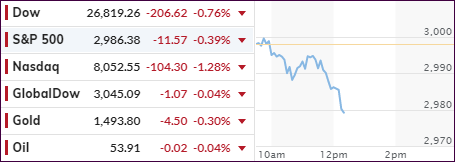
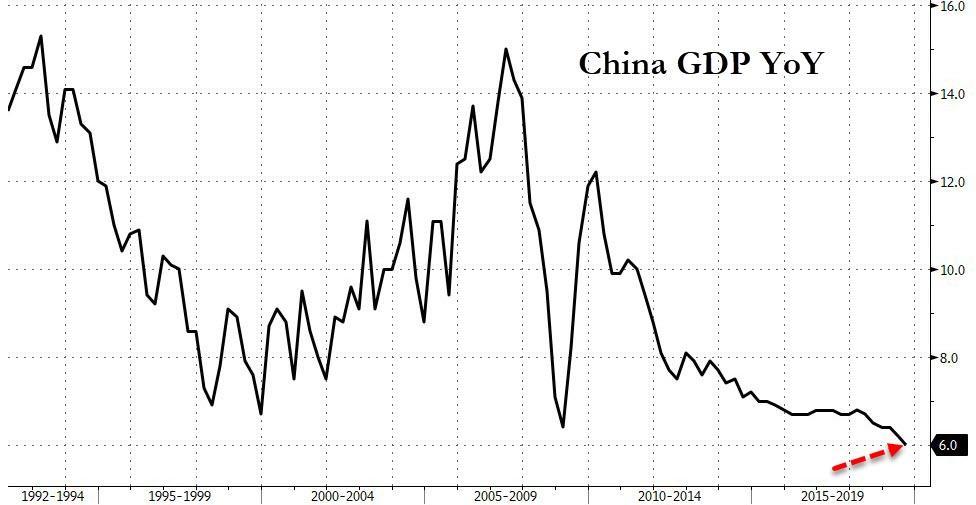
We saw early weakness in part caused by China’s
worst
GDP growth in 30 years registering 6%. As a result, stocks worldwide pulled
back modestly but appear on track to close out the week on the plus side.
Not helping matters was ECB’s Mario Draghi,
who will leave office later this month, but couldn’t help himself to issue a warning
that he sees “mild signs of over-stretched valuations in markets,” contributing
to the early softness in stocks.
Despite relatively upbeat earnings so far, it
seems that a fresh stimulus for equities is needed considering slowing Chinese
activity and the ever-changing stories about the upcoming Brexit and the US-China
trade saga. After all, for the S&P to break through its overhead glass ceiling,
I believe it will take more than your hyped news headlines to bring about a push
of this bullish trend to new all-time highs.
On a personal note, and the reason for this early
release commentary is this. I saw my ophthalmologist a couple of days ago, and
he performed an office procedure to fix a partially detached retina. At this
time, it appears that it was not successful, and I will have to undergo surgery
tonight. The final call will me made this afternoon. I expect to resume posting
on Monday again.
Please note that section 2 and 3 below
contain yesterday’s data, and I hope to make the update sometime this weekend.
ETF Data
updated through Thursday, October 17, 2019
Methodology/Use of this StatSheet:
1. From the universe of over 1,800 ETFs, I have selected only those with a
trading volume of over $5 million per day (HV ETFs), so that liquidity and a
small bid/ask spread are assured.
2. Trend Tracking Indexes (TTIs)
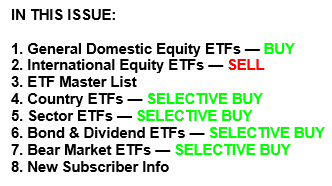
Buy or Sell decisions for Domestic and International ETFs (section 1 and
2), are made based on the respective TTI and its position either above or below
its long-term M/A (Moving Average). A crossing of the trend line from below
accompanied by some staying power above constitutes a “Buy” signal. Conversely,
a clear break below the line constitutes a “Sell” signal. Additionally, I use a
7.5% trailing stop loss on all positions in these categories to control
downside risk.
3. All other investment arenas do not have a TTI and should be traded
based on the position of the individual
ETF relative to its own respective trend line (%M/A). That’s why those signals
are referred to as a “Selective Buy.” In other words, if an ETF crosses its own
trendline to the upside, a “Buy” signal is generated. Since these areas tend to
be more volatile, I recommend a wider trailing sell stop of 7.5% -10% depending
on your risk tolerance.
If you are unfamiliar with some of the terminology, please see Glossary of Termsand new subscriber information in section 9.
1. DOMESTIC EQUITY ETFs: BUY
— since 02/13/2019
Click on chart to enlarge
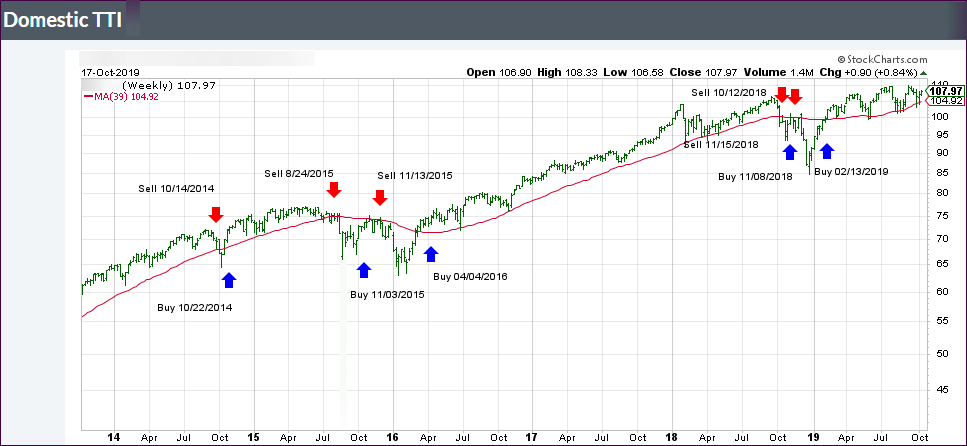
Our main directional indicator, the Domestic Trend Tracking Index (TTI-green line in the above chart) is now positioned above its long-term trend line (red) by +3.17% after having generated a new Domestic “Buy” signal effective 2/13/19 as posted.
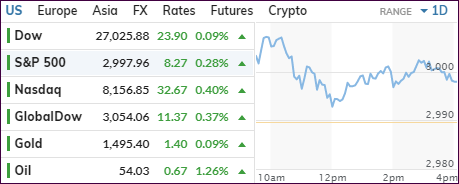
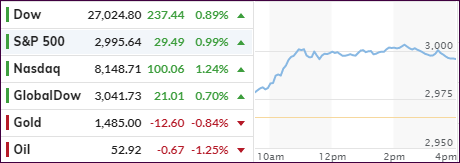
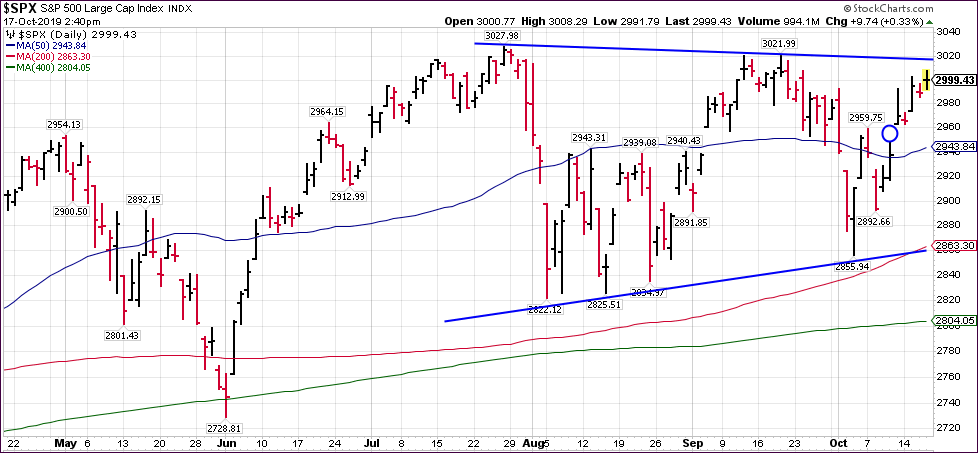
The major indexes edged
higher early on, as the S&P500 fought hard to reclaim its 3,000-milestone
marker. The index fluctuated all day slightly around that level but ended up slightly
below it.
Helping the bullish enthusiasm
were news of a potential Brexit deal, which turned out to be more of a rumor
than a fact. Keep in mind that any new agreement still would need to be
ratified by the British PM and the U.K. Parliament.
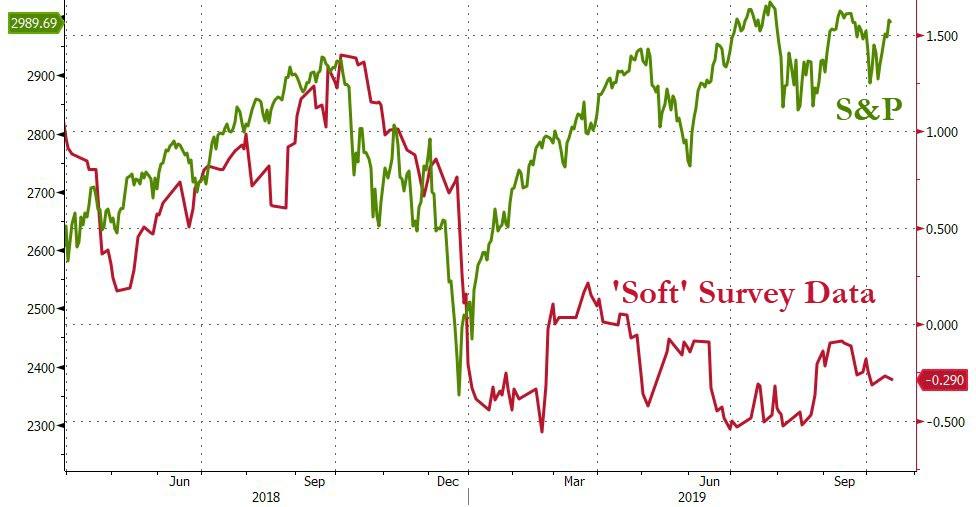
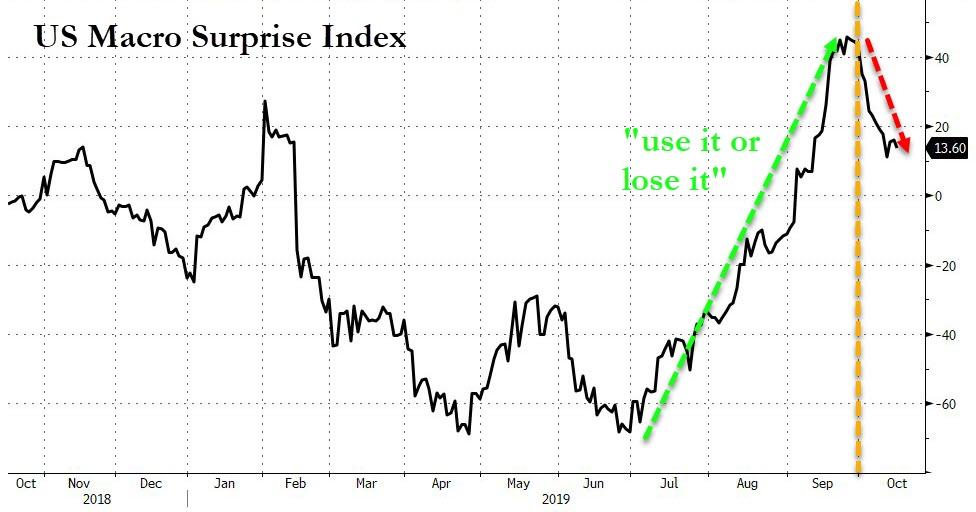
Economically speaking, the
news provided a continued mixed picture, as Soft
Survey data have completely decoupled from stock market levels, while the US
Macro Surprise Index did an about face, causing ZH to quip “use it or lose
it.”
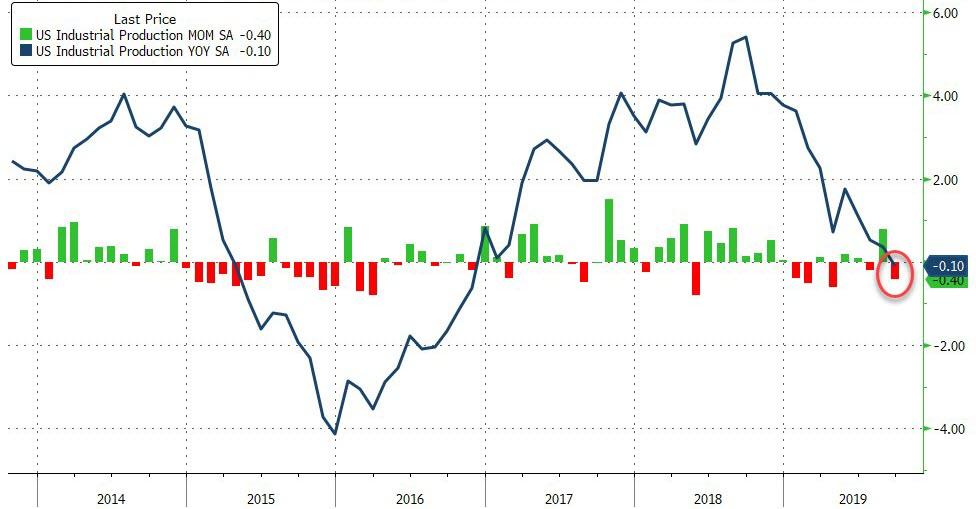
Industrial
Production hit the skids and, on a YoY basis, shrunk for the first time
since Trump’s election in November of 2016.
As I pointed out before, the
US is not an island and, unless there is progress in global trade disputes, domestic
econ data will hit the skids even more, which eventually will affect the direction
of equities. Same trade disputes may impinge on earnings as well, just as last
month, when bellwether FedEx cut its profit outlook in part due to trade and economic
circumstances.
Given that, it’s almost a certainty
that not only the Fed, but also other Central Banks (CBs) as well, will endorse
more rate cuts in coming months to combat economic weakness. And that is exactly
the fly in the ointment: Rates are already so low that CBs don’t have much room
to act and put a bottom under equities. That means, eventually, bad economic news
will be bad news for stocks.
From a technical point of
view, a breakout above the September
highs and then above the July all-time highs could, against all fundamental
odds, bring a resumption of the bull market back into play. These days, anything
is possible, meaning that we need to be prepared to deal with the unexpected.
After the “mini trade” deal faded
yesterday, today’s news brought into question whether anything was accomplished.
Chinese officials essentially confirmed that the progress on the “phase 1” deal
may have been a sham.
Beijing will make good on
the $50 billion of annual agricultural purchases, but only if Washington
agrees to remove all the trade war tariffs. On the other hand, Trump has made
it clear that the tariffs must remain in place until a deal has been implemented
with the Chinese proving that they are abiding by the rules.
While the futures markets
slumped on the news, this was quickly forgotten as the computer algos jumped on
the earnings bandwagon with traders cheering a bunch of ‘not really’ upbeat corporate
earnings reports thereby pushing the “phase 1” trade deal on the back burner. Also
throwing in a temporary assist to the bulls were news of an alleged breakthrough
of the always changing Brexit negotiations.
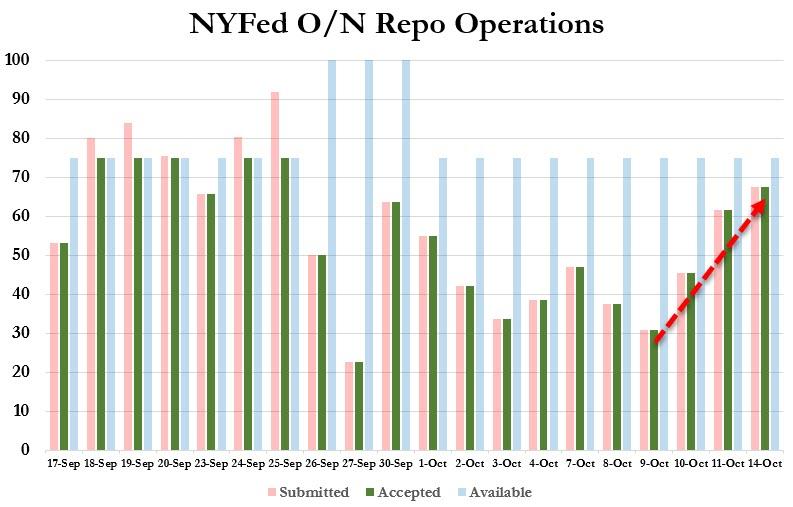
In the meantime, the Fed’s overnight
Repo operations to provide liquidity to banks surged
to nearly $90 billion, which means the initial problem I posted about is anything
but transitory and will eventually affect stock markets. The question in my
mind is not “if” but “when.”
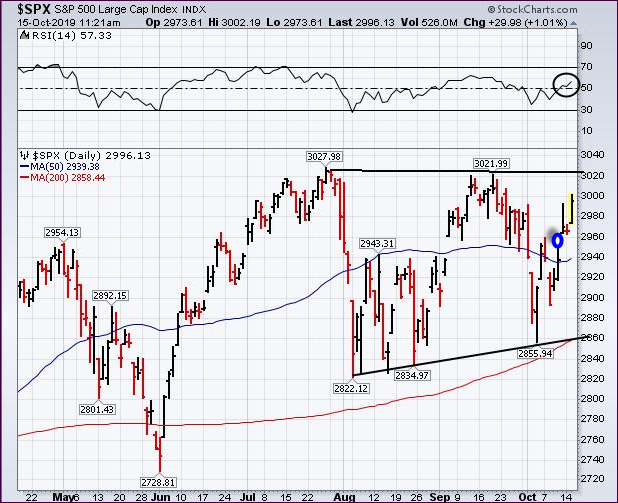
Despite best efforts, the S&P
500 fell short of reclaiming its psychologically important 3,000 level. It may
break through it, but it will then face stiff overhead resistance at the high
end of the trading range at around 3,022. If we get there, the index may very
well turn around again to close its October
break-away gap (blue) before possibly starting another rally attempt.
ZH summed up the rally-on-no-news
like this:
China (negatively)
snubbed Trump’s trade deal overnight, demanding tariffs removed before Ag buy.
China (negatively)
saw CPI surge, somewhat reducing option of brad-based stimulus
Brexit (positively)
was reported as being closer to becoming a deal.
Fed Repo bailout
(negatively) surged to its highest since September.
Tariffs (positively)
did not get implemented today (which is, of course, old news).
Earnings (negatively)
signaled ugliness persists for GS and WFC.
Earnings (positively)
beat (with UNH, JPM and JNJ helping support The Dow).
IMF (negatively)
downgraded global growth to weakest since Lehman.