Weekly StatSheet For The ETF Tracker Newsletter – Updated Through 10/31/2019

Ulli ETF StatSheet Contact

ETF Data updated through Thursday, October 31, 2019
Methodology/Use of this StatSheet:

1. From the universe of over 1,800 ETFs, I have selected only those with a trading volume of over $5 million per day (HV ETFs), so that liquidity and a small bid/ask spread are assured.

2. Trend Tracking Indexes (TTIs)

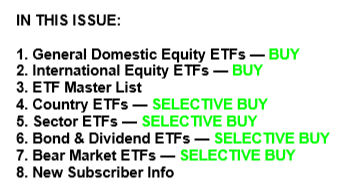
Buy or Sell decisions for Domestic and International ETFs (section 1 and 2), are made based on the respective TTI and its position either above or below its long-term M/A (Moving Average). A crossing of the trend line from below accompanied by some staying power above constitutes a “Buy” signal. Conversely, a clear break below the line constitutes a “Sell” signal. Additionally, I use a 7.5% trailing stop loss on all positions in these categories to control downside risk.

3. All other investment arenas do not have a TTI and should be traded based on  the position of the individual ETF relative to its own respective trend line (%M/A). That’s why those signals are referred to as a “Selective Buy.” In other words, if an ETF crosses its own trendline to the upside, a “Buy” signal is generated. Since these areas tend to be more volatile, I recommend a wider trailing sell stop of 7.5% -10% depending on your risk tolerance.

If you are unfamiliar with some of the terminology, please see Glossary of Terms and new subscriber information in section 9.     

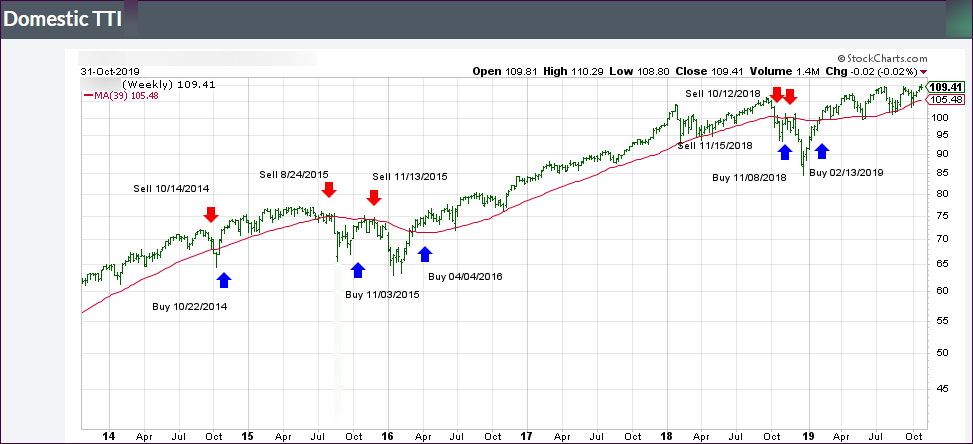
1. DOMESTIC EQUITY ETFs: BUY — since 02/13/2019
Click on chart to enlarge

Our main directional indicator, the Domestic Trend Tracking Index (TTI-green line in the above chart) is now positioned above its long-term trend line (red) by +3.98% after having generated a new Domestic “Buy” signal effective 2/13/19 as posted.

Read More
Surviving October, AKA The Bull Market Killer

Ulli Market Commentary Contact

[Chart courtesy of MarketWatch.com]

  1. Moving the markets

Despite the Fed’s market pleasing efforts yesterday, it appears that the US-China trade talks, or rather the lack thereof, have enough power left to affect market direction. Such was the case this morning when a report said that “Chinese officials have doubts about the prospects for a long-term trade deal with the US.”

Attempting to dampen the subsequent fall of equities, Trump came out and announced that a “transitional deal” would be still signed soon, although the warring parties need to pick a new site for this event, as the previous host, Chile, canceled the mid-November summit.

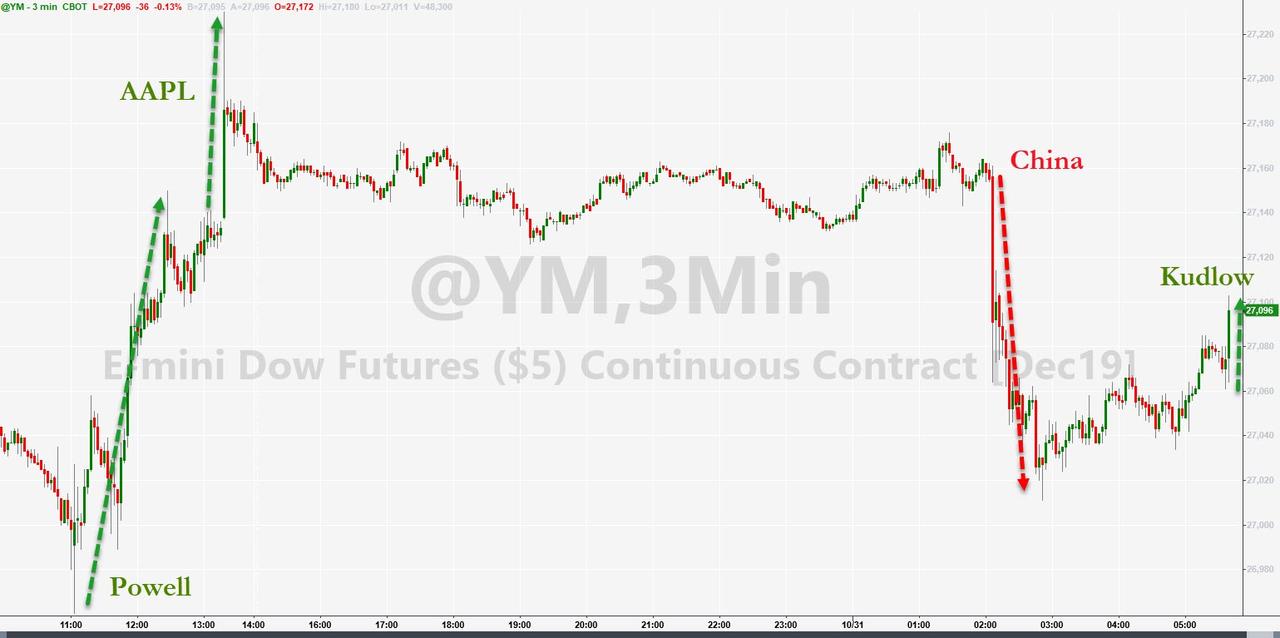
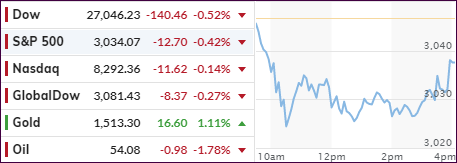
Just the fact that the Dow was down a “shocking” 240 points this morning caused all kinds of action by the administration, as economic advisor Kudlow came out and attempted to jawbone the markets higher with goodies like “US-China talks going smoothly.” It did have a momentary positive effect, as this chart shows.

Then the blame game continued with Trump seething that “China’s not our problem, The Fed is.” You almost have to laugh at the silly notion that it seems no longer acceptable to have a minor correction, let alone a normal downturn as part of the business cycle. But that’s the world we live in, and we must deal with it.

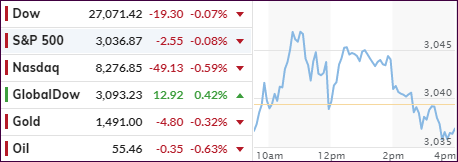
In the end, the month of October, also known as the bull market killer, turned out better than expected, although it started out on a negative note with a 2-day sell-off. That was short-lived, and we seesawed higher with the S&P 500 closing the month with a respectable +1.9% gain.

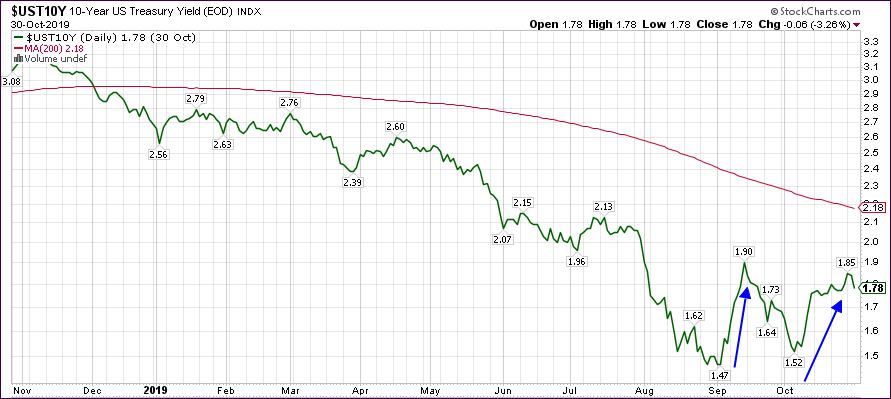
It’s low volatility cousin, SPLV, did not fare as well and got blindsided by bond yields, which rose despite the Fed’s easing efforts. Just like in September, this chart shows the rebound in the 10-year yield (blue arrows), which affected SPLV negatively due to its interest rate component. Even though, SPLV gave back -0.58% this month, it remains ahead of the S&P 500 in YTD ‘Buy’ cycle performance.

Read More

Fed Cuts Rates And Pleases Markets

Ulli Market Commentary Contact

[Chart courtesy of MarketWatch.com]

  1. Moving the markets

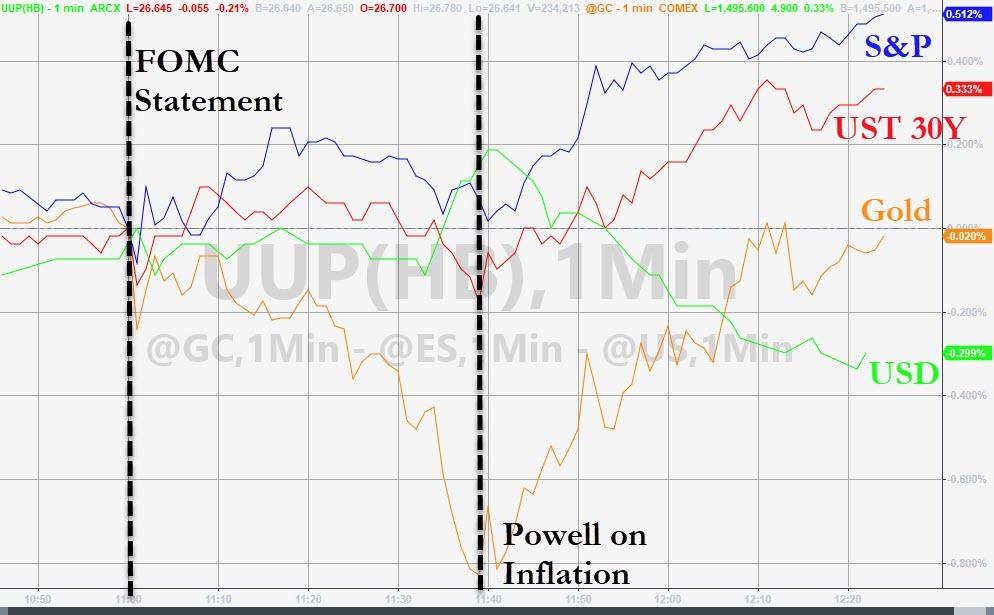
As was expected, the Fed cut interest rates by 0.25%, and analysts were salivating all over the language in the accompanying statement, in order to see what might have been said different this time.

The wording shifted slightly to a more hawkish stance from:

“…will continue to monitor the implications of incoming information for the economic outlook and will act as appropriate to sustain the expansion, with a strong labor market and inflation near its symmetric 2 percent objective.”

To:

“The Committee will continue to monitor the implications of incoming information for the economic outlook as it assesses the appropriate path of the target range for the federal funds rate.”

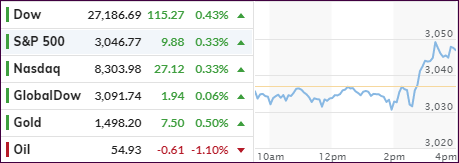
Then Fed chair Powell suggested that “I think we would need to see a really significant move up in inflation that’s persistent before we even consider raising rates to address inflation concerns.” That was the icing on the cake that got the computer algos started, and the major indexes spiked and closed in the green.

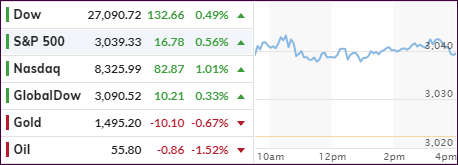
To no surprise, interest rates dropped today with the 10-year bond yield sliding over 6 basis points, which gave a nice assist to the low volatility ETF SPLV, which added +0.73% vs. the more modest performance of the S&P 500 (SPY), which rose +0.33%.

The question now is “can equities trek higher without the Fed’s assistance?” It appears right now that there will be no cut in December (76% odds), so that hope factor is off the table for the time being.  

Despite Trump tweeting that we have “The Greatest Economy in American History,” the factual GDP numbers paint a slightly different picture. The US economy, according to ZH, grew at a 1.9% annualized rate, well above the 1.6% expected, but still below the already weak Q2 print of 2.0%, and matching the second weakest reading of the Trump administration.

Yet, the S&P 500 hovers in record territory, which makes it abundantly clear, contrary to common view, that the stock market and the economy are totally disconnected from each other.

Read More

Slipping Ahead Of The Fed Announcement—Will History Repeat Itself?

Ulli Market Commentary Contact

[Chart courtesy of MarketWatch.com]

  1. Moving the markets

After an early bounce, the markets pulled back with the Nasdaq suffering the most after Google’s disappointing earnings, which followed a few days later after Amazon showed a quarterly report card that was not up to expectations. I was surprised to see this little of a fallout from these 2 behemoths, which usually impact market direction more severely.

It seems traders were more focused on the overall earnings picture, which continued its trend of better-than-feared results. Individual misses, even by large companies, were simply accepted as an outlier.  

The US-China trade debacle was on the radar as well, but after yesterday’s positive noises, the “phase one” deal may not be ready for signing by the time Trump and Xi Jinping meet in Chile next month, according to a Reuters report. That does not surprise me, after all, the dangling trade carrot is merely being used to move markets in the desired direction and not to signal any agreement with substance.

The mixed picture on the economic front featured two events with opposite outcomes. First, we learned that Pending Home Sales surprised to the upside by scoring its biggest annual gain since 2015. This positive event, however, was upset by the fact that Consumer Confidence tumbled to a 7-month low to its lowest since March.

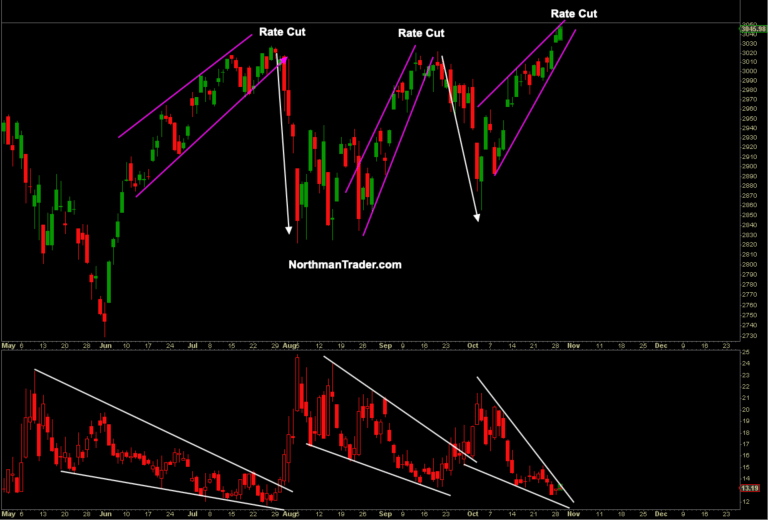
In the end, the major indexes meandered around their respective unchanged lines, as awareness struck traders that not only does tomorrow’s Fed announcement still carry an element of uncertainty, but also reminded them of what happened the last two times rates were lowered.

Read More

Unbridled Optimism Propels Equities

Ulli Market Commentary Contact

[Chart courtesy of MarketWatch.com]

  1. Moving the markets

President Trump set the tone early on for today’s rally by suggesting that “today will be a good day in the stock market,” and just in case the computer algos missed his prediction, he created more excitement via his remark that “the China deal is moving forward ahead of schedule.”

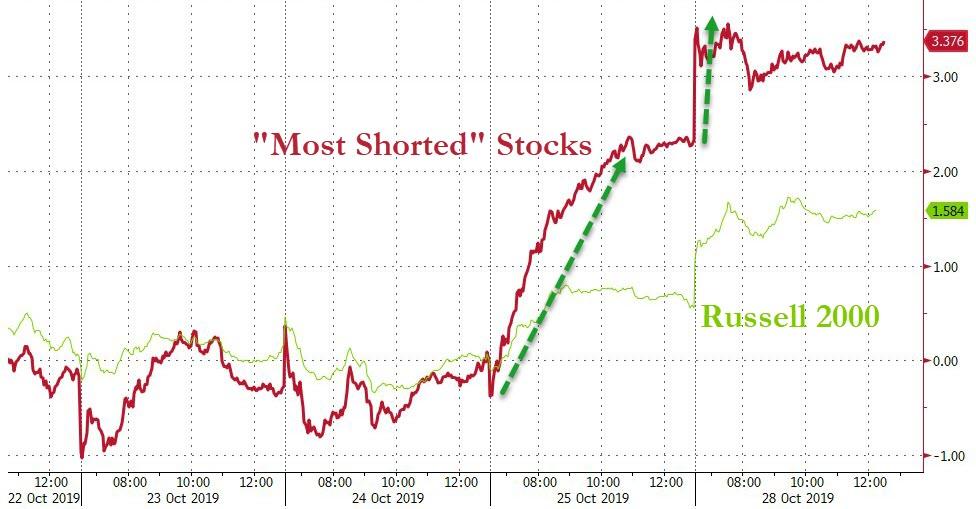
Of course, we know by now that things like global liquidity  and short squeezes rule supreme when it comes to pushing markets higher, as this chart shows.

All the above turned out to be enough to extend the S&P’s move into record territory, while the Dow and Nasdaq were just hovering below their respective record closes set in late July. Of course, traders’ focus remained on the still outstanding earnings reports, of which 162 S&P 500 companies will release their report cards this week.

Earnings from one of the bigger names, like AT&T, were market pleasing with the media giant topping third quarter expectations, while announcing a plan to grow earnings per share by at least 33% by 2020.

Other news, which did not affect markets were the Fed’s meeting on interest rates with the verdict due out Wednesday. A quarter point reduction is expected, and the Fed will have to deliver or the markets sure will have a tizzy fit.

It’s noteworthy, that today was the third day in a row during which bond yields jumped (today by about 5 basis points), and the markets rallied anyway. Usually, rising bond yields tend to pull down equities, but we appear to be stuck in a moment in time, where the opposite is occurring.

That has been a negative, as I posted on Friday, for the low volatility ETF (SPLV), which gave back -0.49% for the day, while the S&P 500 (SPY) managed to score a gain of +0.58%.

Yet, YTD for our current ‘Buy’ signal, the SPLV still has notched superior gains (+12.20%) and remains ahead of SPY (+10.31%), but the victory margin has narrowed. When rates head back south again, however, we will see the pendulum swing back the other way.

Read More

ETFs On The Cutline – Updated Through 10/25/2019

Ulli ETFs on the Cutline Contact

Below, please find the latest High-Volume ETF Cutline report, which shows how far above or below their respective long-term trend lines (39-week SMA) my currently tracked ETFs are positioned.

This report covers the HV ETF Master List from Thursday’s StatSheet and includes 322 High Volume ETFs, defined as those with an average daily volume of more than $5 million, of which currently 274 (last week 250) are hovering in bullish territory. The yellow line separates those ETFs that are positioned above their trend line (%M/A) from those that have dropped below it.

Take a look:                                                                   

The HV ETF Master Cutline Report

In case you are not familiar with some of the terminology used in the reports, please read the Glossary of Terms. If you missed the original post about the Cutline approach, you can read it here.